




















Diamond Wire Saw Cutting Parameters: How Engineers Optimize Speed, Feed Rate, and Tension

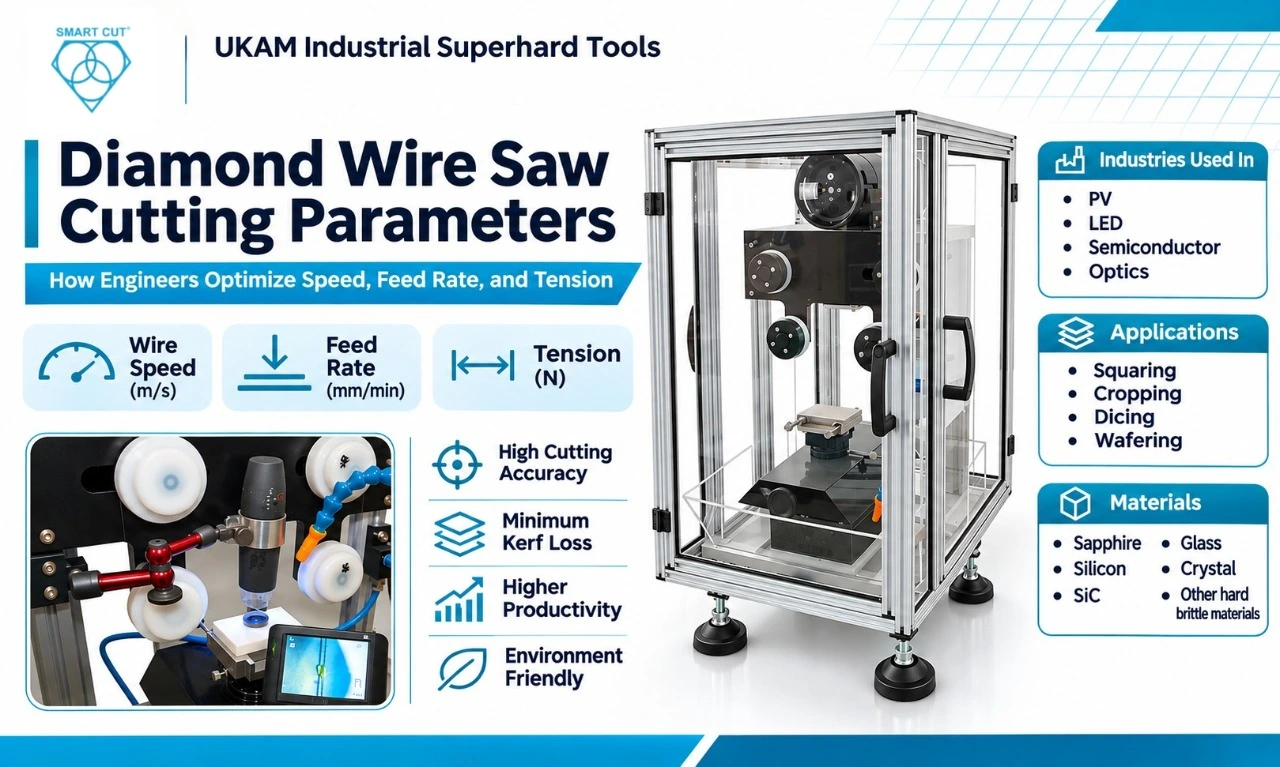
Table of Contents
Toggle
American Based Manufacturer

Established in 1990


Custom manufacturing


Optimize the Qualified Process, Not Just the Cutting Speed
Selecting diamond wire saw cutting parameters requires more than choosing a wire speed and increasing the feed until the machine reaches its limit. The process must meet the required dimensional accuracy, surface quality, material-loss limits, and production rate without exceeding the approved operating limits of the machine and wire.
Wire speed, feed rate, and tension are important variables, but their effects depend on the workpiece material, geometry, wire specification, machine configuration, and coolant conditions. A parameter combination that works for sapphire wafering cannot automatically be transferred to silicon cropping or ceramic cutting.
UKAM’s diamond wire brochure provides two useful references for parameter evaluation: a sapphire wafering case study and a silicon wafering comparison between slurry and diamond wire processes. These examples demonstrate why engineers should assess actual operating conditions and production outcomes rather than treating one parameter setting as universal.
The purpose of this article is to explain how to establish a baseline, evaluate the main parameters, interpret those case studies, and qualify a repeatable operating window.
Define the Process Requirements Before Adjusting Parameters
Before optimizing a cutting recipe, define what the process must achieve. A higher feed rate may reduce cutting time, but the change is only useful if the resulting parts continue to meet their acceptance requirements.
Record the requirements before testing any new settings.
|
Requirement |
What to document |
Engineering purpose |
|---|---|---|
|
Material |
Grade, lot, condition, and crystal orientation where relevant |
Establishes the material being processed |
|
Workpiece geometry |
Dimensions, cut length, and support arrangement |
Defines the cutting engagement and setup |
|
Wire specification |
Product, wire diameter, core diameter, abrasive specification, and lot |
Establishes the consumable configuration |
|
Wire speed |
Programmed setting and actual value where available |
Provides a measurable operating reference |
|
Feed rate |
Programmed rate and actual feed behavior |
Connects process settings to cutting time |
|
Tension |
Approved setpoint and measured value where available |
Establishes the mechanical operating condition |
|
Product, concentration, flow, temperature, and delivery position |
Documents the cutting environment |
|
|
Quality requirements |
Kerf, dimensions, edge condition, surface quality, and subsurface-damage criteria where applicable |
Defines acceptable output |
|
Production targets |
Cutting time, total cycle time, and accepted parts per shift |
Establishes productivity requirements |
|
Consumable usage |
Wire length or other suitable consumption measure |
Supports cost-per-part calculations |
Use an existing qualified recipe as the baseline when one is available for the same material, machine, wire configuration, and workpiece geometry. For a new application, establish initial settings from the applicable machine and wire documentation.
Do not begin optimization by copying a setting from an unrelated application. The operating conditions must be suitable for the specific system being qualified.
Wire Speed: Evaluate Productivity and Process Stability
Wire speed describes how quickly the wire moves through the cutting zone. Its effect on productivity depends on the cutting system, wire construction, workpiece material, feed rate, and machine design.
Increasing wire speed does not automatically increase the rate at which material is removed. The workpiece must still advance through the cut, and the process must remain within its mechanical and quality limits.
When evaluating wire speed, record:
- Wire consumption.
- Machine behavior and repeatability.
Change wire speed only within the limits specified for the equipment and wire. Use a defined trial to determine whether the new setting improves the required production outcome.
For example, if a faster setting reduces cutting time but increases dimensional variation, the change may not be suitable for production. The correct setting is the one that satisfies the complete set of acceptance criteria.
Feed Rate: Connect Cutting Time to Accepted Output
Feed rate describes the advancement of the workpiece or cutting assembly into the cut, depending on the machine design. It is different from wire speed.
Feed rate directly affects the time required for a cut, but its relationship with productivity is not necessarily linear. Machine limits, workpiece geometry, entry and exit conditions, and the behavior of the cutting process can influence the result.
When increasing feed rate, engineers should verify that the process continues to meet:
Record both the programmed feed and the actual cutting time. A programmed feed increase does not prove that the production cycle improved by the same proportion.
The following UKAM brochure case studies illustrate why feed-rate data should be interpreted alongside machine configuration, workpiece geometry, and production output.
Case Study 1: Sapphire Wafering on a Takatori MWS-612DD
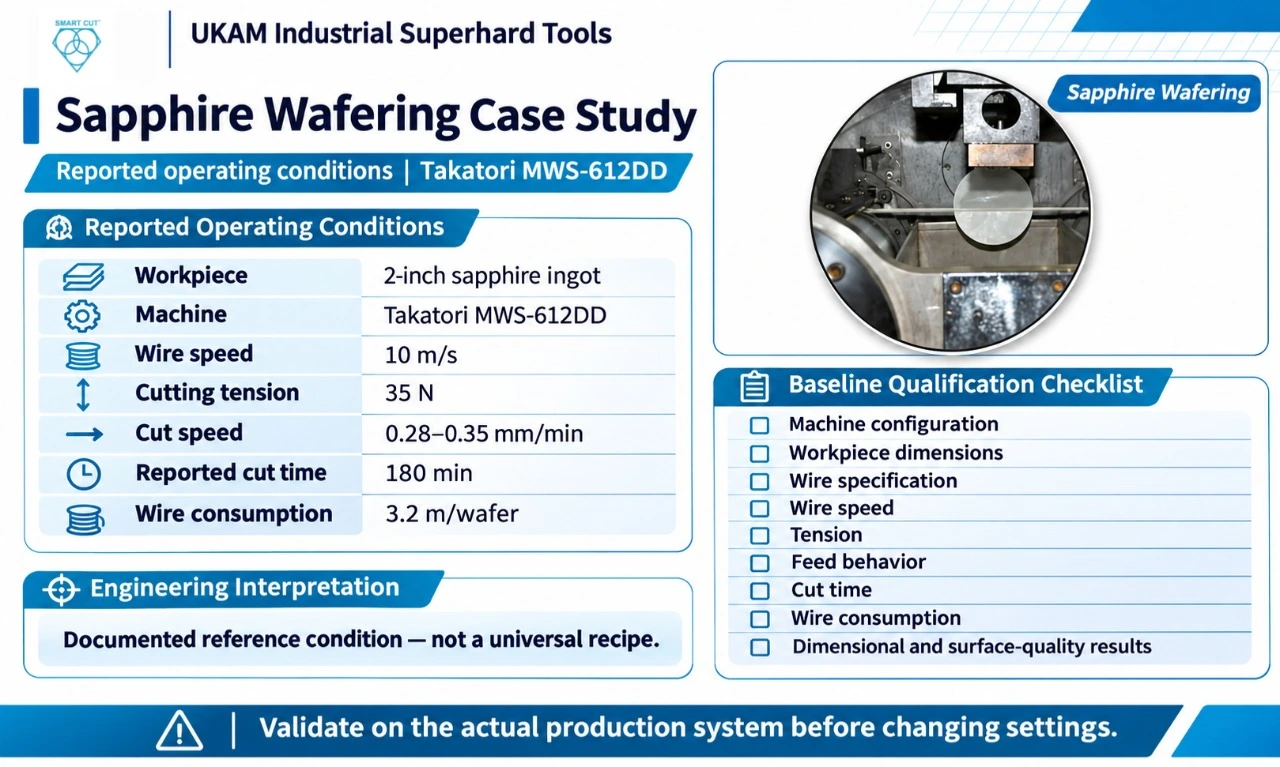
UKAM’s diamond wire brochure includes a case study for wafering a 2-inch sapphire ingot. The listed process conditions are shown below.
Source: UKAM diamond wire brochure, sapphire wafering case study.
Workpiece
2-inch sapphire ingot
Machine
Takatori MWS-612DD
Wire speed
10 m/s
Cutting tension
35 N
Cut speed
0.28–0.35 mm/min
Reported cut time
180 min
Wire consumption
3.2 m/wafer
What the case study establishes
The brochure documents a specific combination of machine, workpiece, wire speed, tension, cutting speed, cutting time, and wire consumption. It provides a concrete reference for the type of operating data that should be recorded when qualifying a sapphire wafering process.
It does not establish that 10 m/s and 35 N are suitable settings for every sapphire application. Machine configuration, wire specification, workpiece dimensions, and quality requirements may differ.
The reported 0.28–0.35 mm/min cut speed should also be distinguished from wire speed. They describe different aspects of the process and should not be treated as interchangeable parameters.
How an engineer should use this example
For a comparable sapphire application, begin by checking whether the machine, workpiece dimensions, wire specification, and operating method are sufficiently similar to make the case study relevant.
Then establish a baseline using the actual production system. Record wire speed, tension, feed behavior, cut time, wire consumption, and quality results. Any change to the operating conditions should be evaluated against that baseline.
If the objective is to reduce cutting time, the engineer must verify that the faster condition still meets dimensional and surface-quality requirements. If the objective is to reduce consumable cost, wire consumption per accepted wafer must be measured rather than inferred from cutting time alone.
Engineering conclusion: the case study is a documented reference condition, not a universal recipe or a guarantee of equivalent results on another machine.
Case Study 2: Silicon Wafering Comparison Between Slurry and Diamond Wire
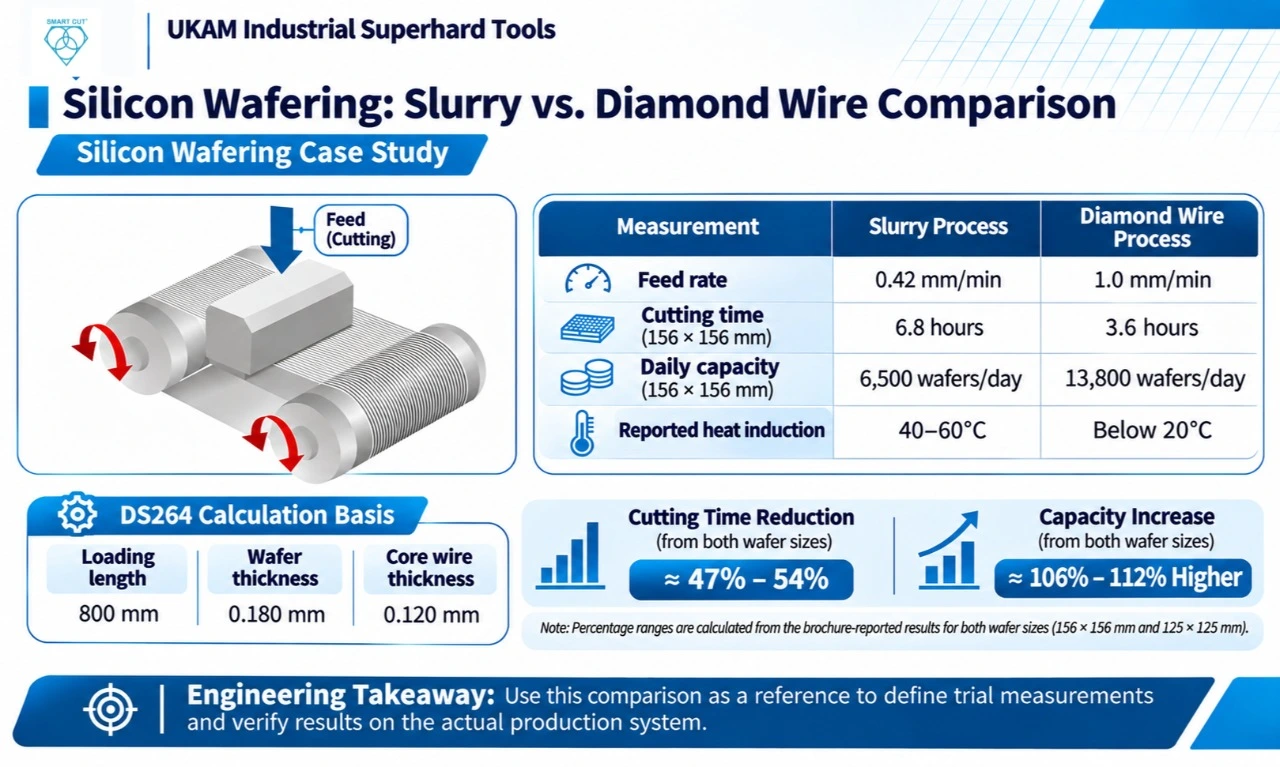
The UKAM brochure also compares slurry and diamond wire wafering using a DS264 calculation basis. The stated basis includes:
- Loading length: 800 mm.
- Wafer thickness: 0.180 mm.
- Core wire thickness: 0.120 mm.
The brochure provides example feed rates and reported cutting times and daily wafer capacities for two silicon wafer sizes.
Brochure-reported comparison
|
Measurement |
Slurry process |
Diamond wire process |
|---|---|---|
|
Example feed rate |
0.42 mm/min |
1.0 mm/min |
|
Cutting time for 156 × 156 mm silicon |
6.8 hours |
3.6 hours |
|
Reported capacity for 156 × 156 mm wafers |
6,500 wafers/day |
13,800 wafers/day |
|
Cutting time for 125 × 125 mm silicon |
5.6 hours |
2.6 hours |
|
Reported capacity for 125 × 125 mm wafers |
7,800 wafers/day |
16,100 wafers/day |
|
Reported heat induction |
40–60°C |
Below 20°C |
Interpreting the reported cutting times
For 156 × 156 mm silicon, the brochure lists 6.8 hours for slurry cutting and 3.6 hours for diamond wire cutting.
The reduction based on those reported values is:
For 125 × 125 mm silicon, the reported cutting times are 5.6 hours and 2.6 hours respectively.
These percentages are calculations from the brochure’s figures. They describe the stated comparison, not an independently verified result for every silicon cutting operation.
Interpreting the reported daily capacity
The brochure lists 13,800 versus 6,500 wafers per day for the 156 × 156 mm format, and 16,100 versus 7,800 wafers per day for the 125 × 125 mm format.
These are reported capacity figures. They should not be used as a production forecast without confirming the underlying assumptions, including machine utilization, loading and unloading time, operating schedule, yield, and the precise process configuration.
What engineers should take from this comparison
The comparison illustrates the importance of evaluating cutting parameters together with throughput. Feed rate is relevant, but it is only one part of the production system.
When evaluating a process change, engineers should confirm:
- Whether the compared machines and operating conditions are equivalent.
- Whether the stated feed rates represent actual production conditions.
- Whether the reported cutting time includes only cutting or a broader cycle.
- Whether the capacity calculation accounts for setup, downtime, and rejected parts.
- Whether the output meets the required dimensional and surface-quality criteria.
The reported heat-induction values should also be interpreted within the brochure’s stated comparison. They should not be treated as a guarantee of workpiece temperature in every process.
Engineering conclusion: use published comparisons to identify questions and define trial measurements. Use actual production records to establish whether the same result is achievable in the target application.
Tension: Use Approved Operating Limits, Not Breaking Force
Tension influences wire stability and the mechanical loading of the cutting system. The appropriate setting depends on the wire, machine, workpiece, and operating method.
The 35 N tension listed in the sapphire case study belongs to that specific reported setup. It must not be copied automatically to another wire or machine.
Engineers should distinguish:
- Operating tension: the approved tension used during cutting.
- Breaking force: the load associated with wire failure under specified test conditions.
- Measured tension: the value observed in the actual operating system, where measurement is available.
These are not interchangeable values.
When qualifying tension, confirm the permitted operating range in the applicable wire and machine documentation. Record the setpoint and actual value where available, then evaluate cut accuracy, wire stability, breakage, and process repeatability.
Do not raise tension beyond approved limits to compensate for unsuitable feed settings, poor alignment, or other process problems.
Build a Parameter Qualification Plan
A structured trial makes it possible to compare operating conditions without confusing the effects of different variables.
The following is a qualification framework, not a numerical recipe.
|
Trial stage |
Parameter action |
Measurements required |
|---|---|---|
|
Baseline |
Run the existing qualified condition |
Cutting time, quality, wire consumption, and machine behavior |
|
Wire-speed trial |
Change wire speed within approved limits |
Cutting time, quality, consumable usage, and stability |
|
Feed-rate trial |
Test a candidate feed rate while controlling other relevant variables |
Actual cutting time, dimensions, surface condition, and rejection rate |
|
Tension review |
Verify or test an approved tension setting where justified |
Wire stability, accuracy, breakage, and repeatability |
|
Combined condition |
Test the selected parameter combination |
Complete quality and production evaluation |
|
Confirmation run |
Repeat the candidate condition across a suitable sample |
Variation, accepted-part yield, and reproducibility |
Where variables interact, a designed experiment may be more informative than testing each variable independently. Define the trial conditions and acceptance criteria before starting.
For each run, document the material lot, wire lot, machine configuration, coolant conditions, parameter settings, sample size, and inspection results.
A candidate condition should be rejected if it violates an operating limit or fails a critical quality requirement, even if it reduces cutting time.
Evaluate Cost Per Accepted Part
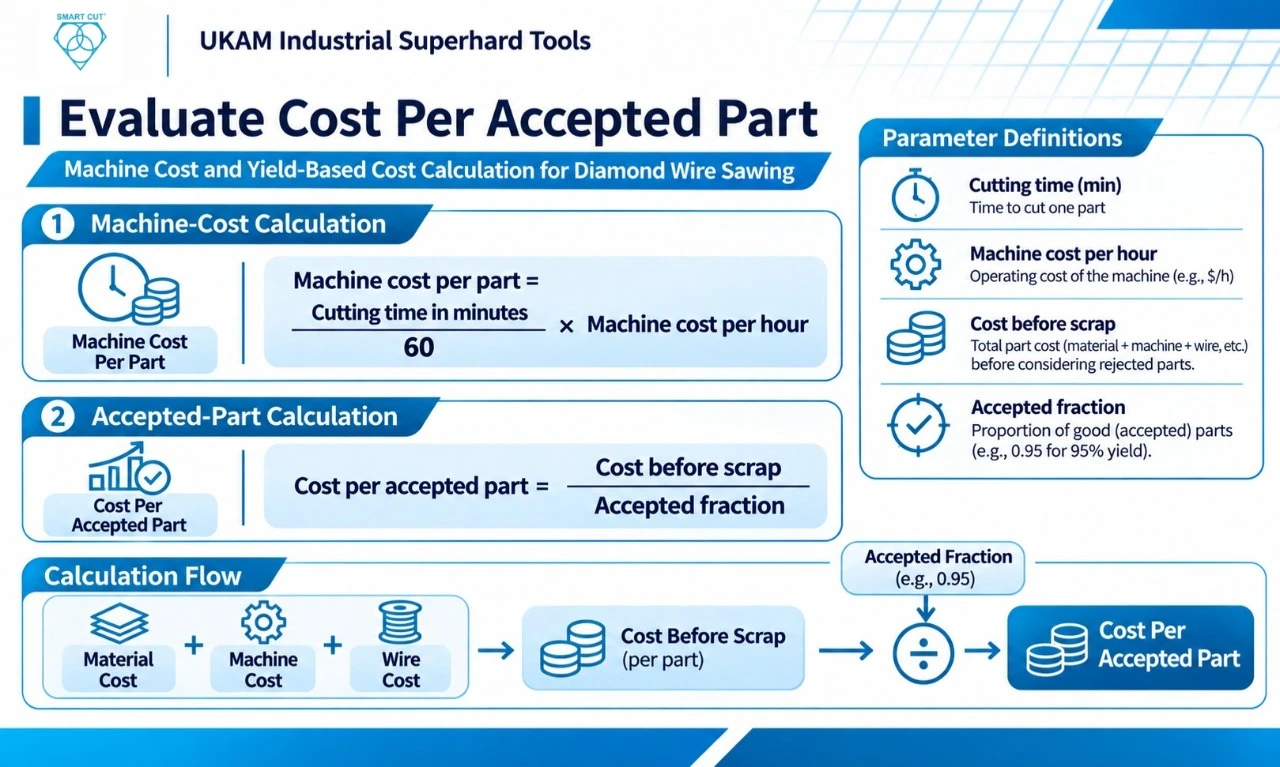
Parameter optimization should consider the cost of producing an acceptable part, not just the time required to complete a cut.
The cost calculation can include wire consumption, machine time, scrap, rework, inspection, coolant, and relevant downtime. Use the same cost boundaries when comparing candidate settings.
The following example is hypothetical and is included only to demonstrate the calculation method.
|
Measure |
Trial A |
Trial B |
|---|---|---|
|
Wire cost per part |
$1.00 |
$1.10 |
|
Cutting time per part |
12 minutes |
9 minutes |
|
Machine cost rate |
$60/hour |
$60/hour |
|
Machine cost per part |
$12.00 |
$9.00 |
|
Combined cost before scrap |
$13.00 |
$10.10 |
|
Assumed rejection rate |
5% |
2% |
|
Accepted fraction |
95% |
98% |
|
Estimated cost per accepted part |
$13.68 |
$10.31 |
The machine-cost calculation is:
Machine cost per part =
Cutting time in minutes60 ×
Machine cost per hour
The simplified accepted-part calculation is:
For Trial A:
For Trial B:
$10.100.98≈ $10.31
Under these assumptions, Trial B has a lower estimated cost per accepted part despite the higher assumed wire cost.
These figures are not UKAM pricing or verified performance data. The calculation excludes labor, coolant, maintenance, inspection, downtime, and downstream finishing. Actual decisions should use measured production costs and representative quality data.
Production Release Checklist
Before approving a new cutting-parameter combination, verify the following:
- Material, geometry, machine, and wire configuration are documented.
- The baseline condition is recorded.
- Wire speed and feed rate are recorded separately.
- Operating tension is within the approved range.
- Coolant conditions follow the applicable instructions.
- The trial conditions and parameter changes are documented.
- Dimensional, surface, and other critical quality requirements are met.
- Cutting time and total cycle time are recorded separately.
- Wire consumption and accepted-part yield are measured.
- Repeatability is demonstrated across a suitable sample.
- The cost comparison uses equivalent cost boundaries.
- Approved settings and inspection requirements are documented.
A faster single cut is not sufficient evidence for process release. The selected parameter set must demonstrate acceptable quality and repeatable performance under representative conditions.
Frequently Asked Questions
Wire speed, feed rate, and tension are key variables, but their effects depend on the machine, wire specification, workpiece, and coolant conditions. Engineers should qualify the parameters against the actual dimensional, surface-quality, and productivity requirements.
Not without qualification. The brochure reports a specific setup using a Takatori MWS-612DD and a 2-inch sapphire ingot. Another machine, wire specification, workpiece geometry, or quality requirement may require different settings.
It reports cutting-time and daily-capacity comparisons between slurry and diamond wire processes under a stated DS264 calculation basis. The figures are useful as source-specific comparison data, but the underlying assumptions should be checked before using them to forecast production.
No. A higher feed rate may reduce cutting time, but it must remain within the approved operating limits and meet quality requirements. Evaluate actual cutting time, dimensional accuracy, surface condition, wire consumption, and accepted-part yield.
Use the applicable wire and machine documentation to establish the approved operating range. Do not use breaking force as the operating-tension target. The 35 N value in the sapphire case study is specific to the reported setup and is not a universal recommendation.
Compare it with a documented baseline using the same inspection methods. Evaluate cutting time, total cycle time, dimensional results, surface quality, consumable use, rejection rate, and repeatability. A change should be accepted only when it meets the required quality and operating criteria.
A faster process may still be more expensive if it increases scrap, rework, or consumable usage. Cost per accepted part combines production cost and yield, making it a more useful comparison metric than cycle time alone.
Conclusion: Qualify the Parameters Against the Actual Application
Diamond wire saw optimization should be based on measured process results, not a universal speed chart or a single machine setting copied from another application.
The UKAM sapphire case study provides a documented reference for a specific machine and workpiece. The silicon wafering comparison provides source-reported cutting-time and throughput figures under a stated calculation basis. Both are useful when interpreted within their documented conditions.
For production decisions, establish a baseline, qualify wire speed and feed rate, verify operating tension, and measure quality, consumable use, and accepted-part yield. Document the final operating window and confirm that it performs repeatably before releasing the process.
The best parameter combination is the one that meets the application’s quality requirements while achieving an acceptable and reproducible production cost.
Related UKAM resources
- SMART CUT® Diamond Wire Product Page
- Guide to Diamond Wire Sawing: Technologies, Wire Types, and Machine Designs
These pages provide broader product and technology information. This article’s distinct purpose is to help engineers establish, evaluate, and qualify cutting parameters using measurable process evidence.
Trusted by Tens of Thousands of Manufacturers, Laboratories,
Research Institutions Worldwide Since 1990
American Based Manufacturer
Established in 1990
