






















How to Measure Precision Diamond Blade Cut Quality: Chipping, Kerf, Flatness, Subsurface Damage, and Material Loss


Table of Contents
ToggleSelecting a precision diamond blade based solely on cutting speed, blade life, or purchase price rarely provides an accurate assessment of overall cutting performance.
For manufacturers processing high-value materials—including semiconductor wafers, sapphire, advanced ceramics, tungsten carbide, composites, optical glass, quartz, medical device components, and aerospace materials—the quality of the cut directly influences downstream manufacturing operations. Poor sectioning can increase polishing time, introduce dimensional inaccuracies, reduce material yield, compromise inspection results, and ultimately increase the total manufacturing cost of every acceptable part.
The challenge is that cut quality is often evaluated subjectively.
Statements such as:
● “This blade cuts smoother.”
● “Blade A chips less than Blade B.”
● “The surface finish looks better.”
provide little engineering value because they cannot be quantified, repeated, or compared under controlled conditions.
Meaningful blade evaluations require objective measurements performed using standardized procedures.
To compare two diamond blades fairly, every significant characteristic of the cut should be measured using the same inspection equipment, the same operating conditions, the same measurement methodology, and the same reporting format.
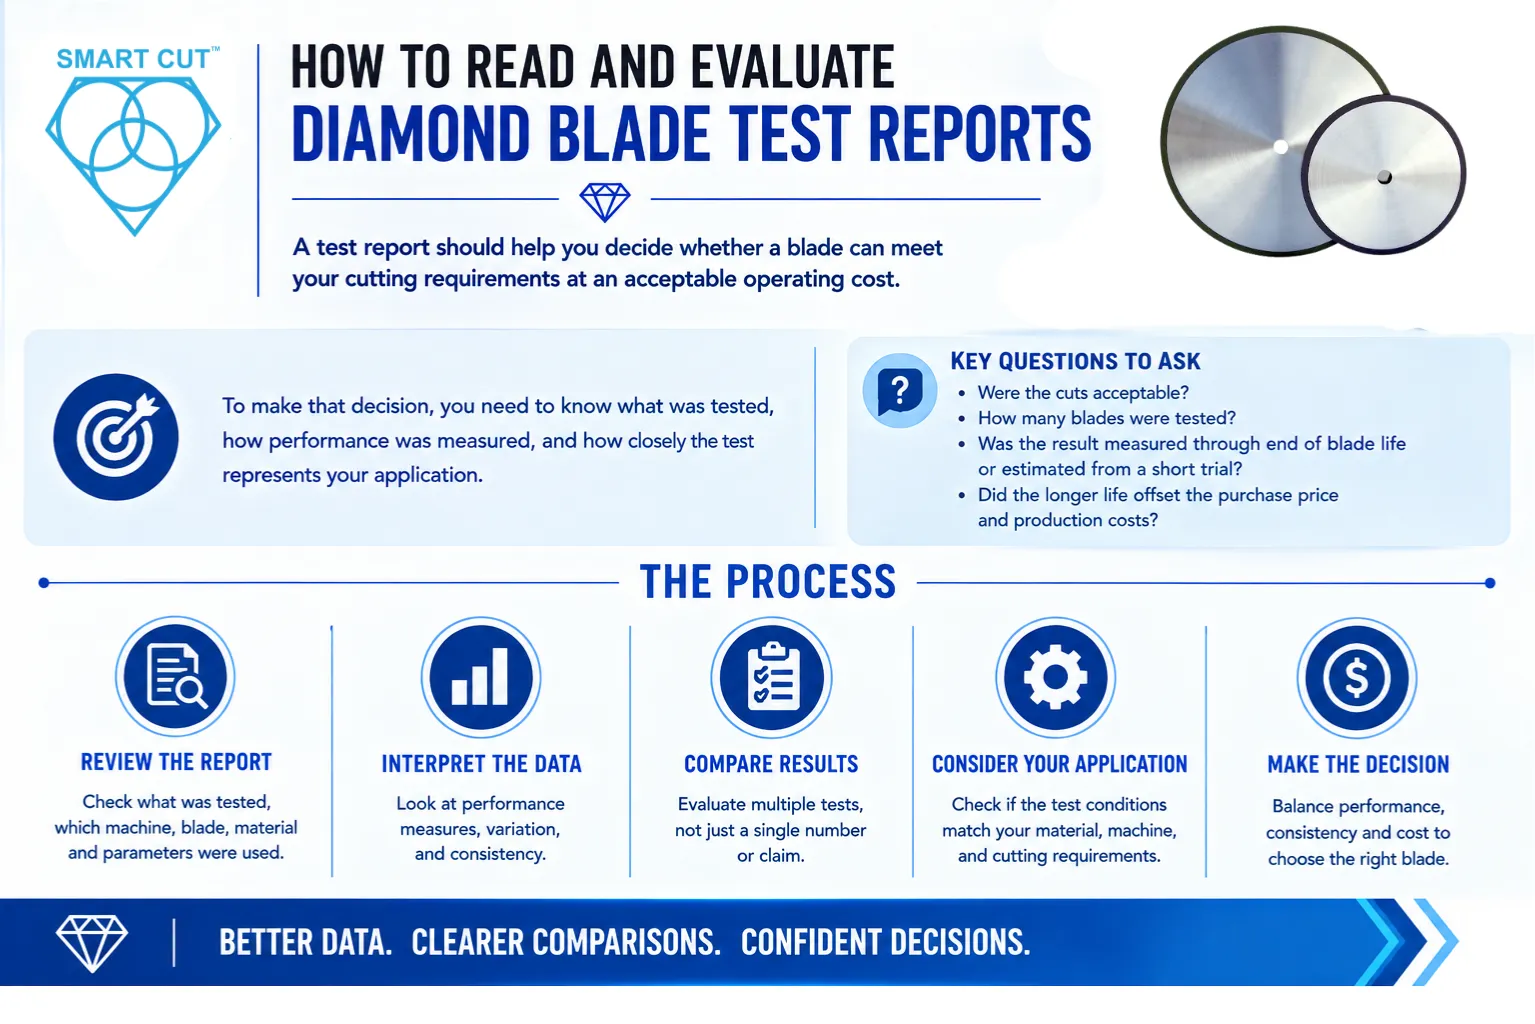
This guide provides a practical framework for evaluating precision diamond blade performance using measurable engineering data rather than visual judgment.
Rather than asking:
Which blade feels like it cuts better?
Engineers should be able to answer:
● Which blade produces the lowest average edge chipping?
● Which blade maintains the most consistent kerf throughout its service life?
● Which blade generates the least subsurface damage?
● Which blade preserves the greatest amount of expensive material?
● Which blade minimizes downstream grinding and polishing?
● Which blade produces the lowest total manufacturing cost per acceptable component?
By following standardized measurement procedures, manufacturers can:
● Compare different blade manufacturers objectively.
● Evaluate new blade specifications.
● Optimize feed rates and spindle speeds.
● Establish internal blade qualification procedures.
● Develop repeatable Standard Operating Procedures (SOPs).
● Improve process capability and production consistency.
● Reduce scrap, material waste, and polishing costs.
The procedures presented in this guide can be adapted for laboratory evaluations, production quality control, process development, and blade qualification across a wide range of precision cutting applications.
Trusted by Tens of Thousands of Manufacturers, Laboratories Research Institutions Worldwide Since 1990

American Based Manufacturer

Established in 1990


Custom manufacturing



Many blade comparisons fail before inspection even begins because the blades are not tested under identical conditions.
For example:
Blade A
● 2,500 RPM
● 8 mm/min feed rate
● New coolant
● New blade
● Experienced operator
Blade B
● 3,800 RPM
● 18 mm/min feed rate
● Contaminated coolant
● Blade already used for 150 cuts
● Different operator
Although both blades may be cutting the same material, the comparison is no longer valid because multiple process variables changed simultaneously.
The resulting differences may have nothing to do with blade design.
They may instead be caused by:
● Feed rate
● Machine rigidity
● Spindle runout
● Operator technique
● Blade wear
● Workholding
● Coolant delivery
● Material variability
For this reason, professional blade evaluations always isolate one variable:
The blade itself.
Every other parameter should remain unchanged throughout the evaluation.
Only then can differences in cut quality be attributed to blade performance.
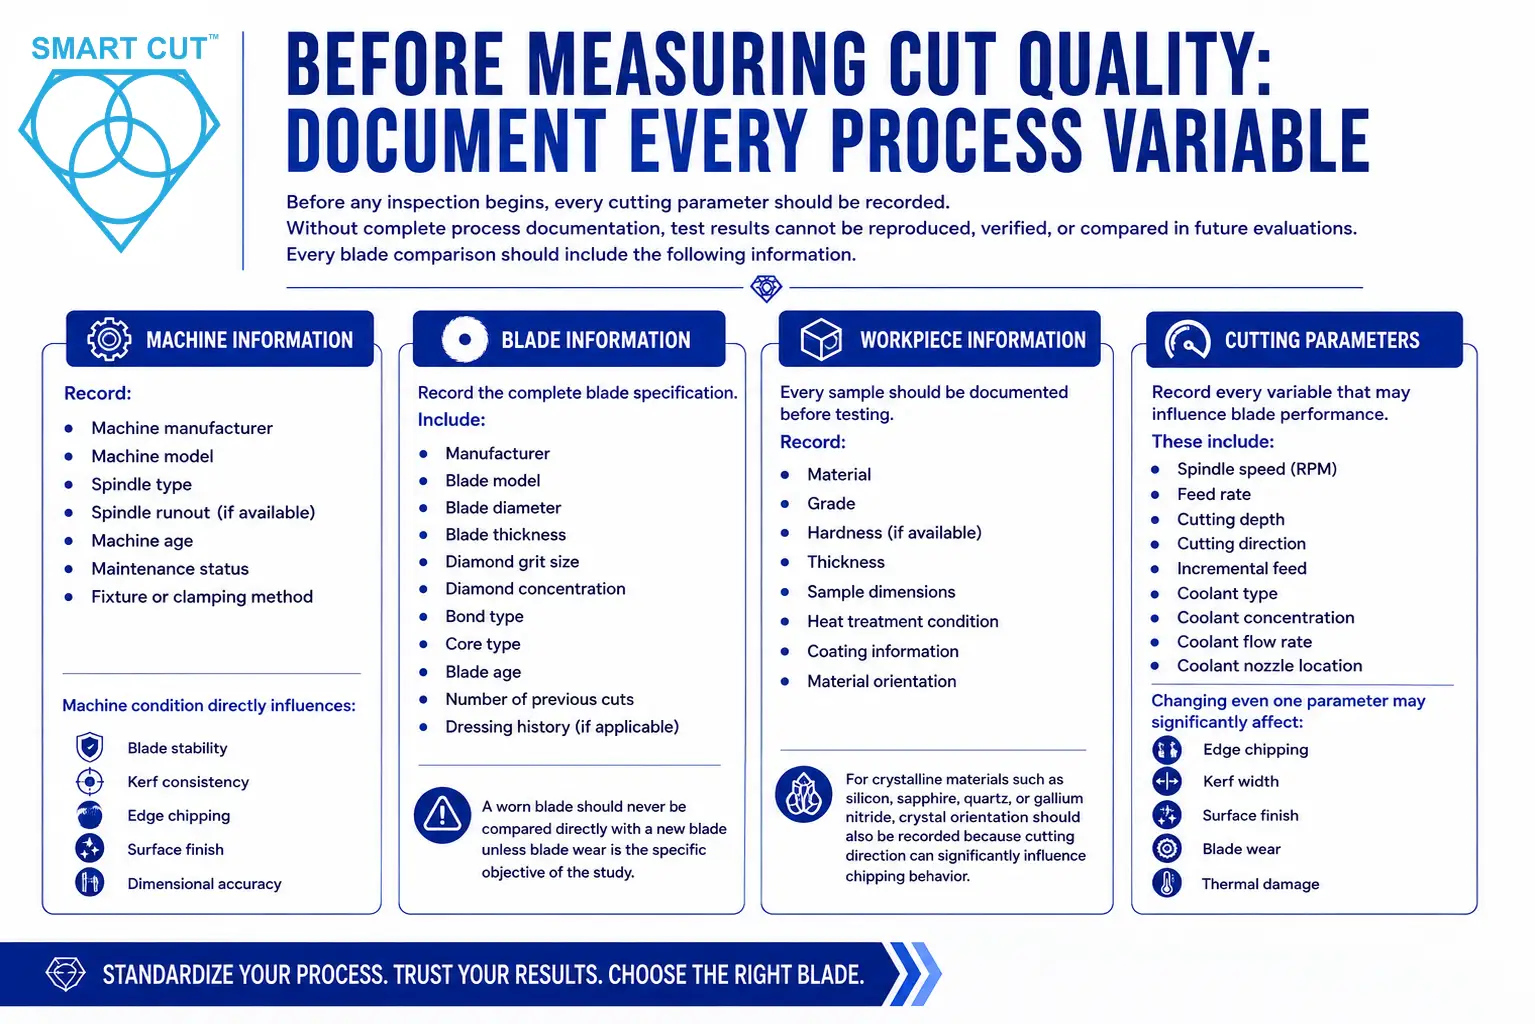
Before any inspection begins, every cutting parameter should be recorded.
Without complete process documentation, test results cannot be reproduced, verified, or compared in future evaluations.
Every blade comparison should include the following information.
Machine Information
Record:
● Machine manufacturer
● Machine model
● Spindle type
● Spindle runout (if available)
● Machine age
● Maintenance status
● Fixture or clamping method
Machine condition directly influences:
● Blade stability
● Kerf consistency
● Edge chipping
● Surface finish
● Dimensional accuracy
Blade Information
Record the complete blade specification.
Include:
● Manufacturer
● Blade model
● Blade diameter
● Blade thickness
● Diamond grit size
● Bond type
● Core type
● Blade age
● Number of previous cuts
● Dressing history (if applicable)
A worn blade should never be compared directly with a new blade unless blade wear is the specific objective of the study.
Workpiece Information
Every sample should be documented before testing.
Record:
● Material
● Grade
● Hardness (if available)
● Thickness
● Sample dimensions
● Heat treatment condition
● Coating information
● Material orientation
For crystalline materials such as silicon, sapphire, quartz, or gallium nitride, crystal orientation should also be recorded because cutting direction can significantly influence chipping behavior.
Cutting Parameters
Record every variable that may influence blade performance.
These include:
● Spindle speed (RPM)
● Feed rate
● Cutting depth
● Cutting direction
● Incremental feed
● Coolant type
● Coolant concentration
● Coolant flow rate
● Coolant nozzle location
Changing even one parameter may significantly affect:
● Edge chipping
● Kerf width
● Surface finish
● Blade wear
● Thermal damage
Maintaining identical operating conditions is essential for producing meaningful blade comparisons.
Equipment Required for Precision Blade Evaluation
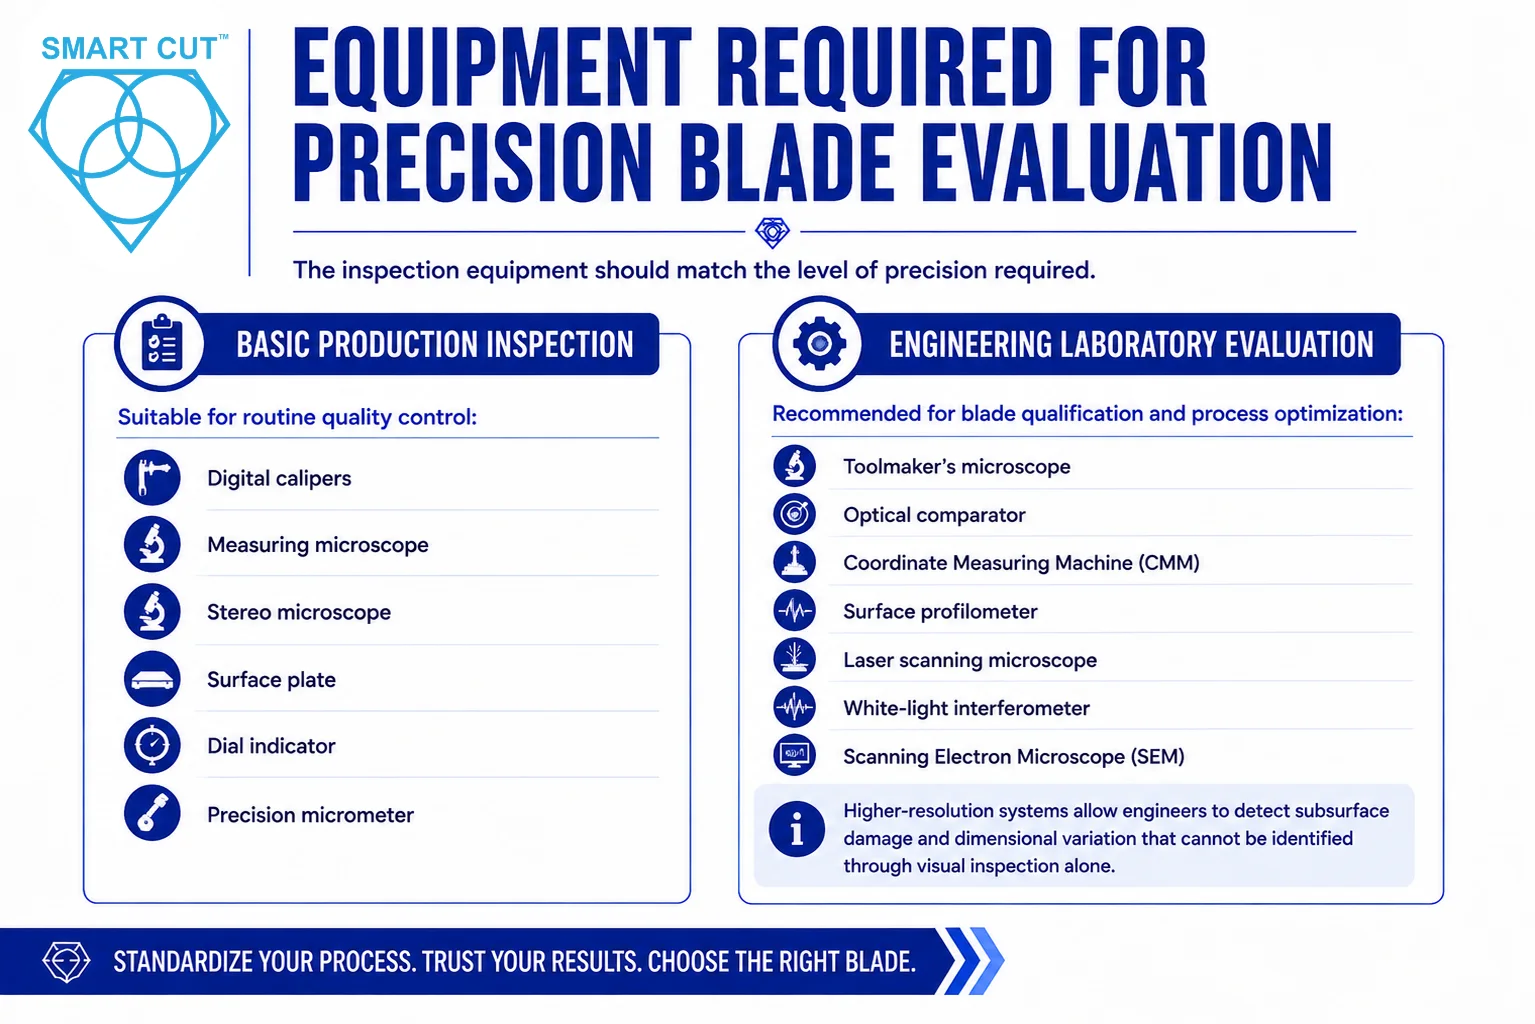
The inspection equipment should match the level of precision required.
Basic Production Inspection
Suitable for routine quality control:
● Digital calipers
● Measuring microscope
● Stereo microscope
● Surface plate
● Dial indicator
● Precision micrometer
Engineering Laboratory Evaluation
Recommended for blade qualification and process optimization:
● Toolmaker’s microscope
● Optical comparator
● Coordinate Measuring Machine (CMM)
● Surface profilometer
● Laser scanning microscope
● White-light interferometer
● Scanning Electron Microscope (SEM)
Higher-resolution systems allow engineers to detect subsurface damage and dimensional variation that cannot be identified through visual inspection alone.
Standard Operating Procedure Before Any Measurements
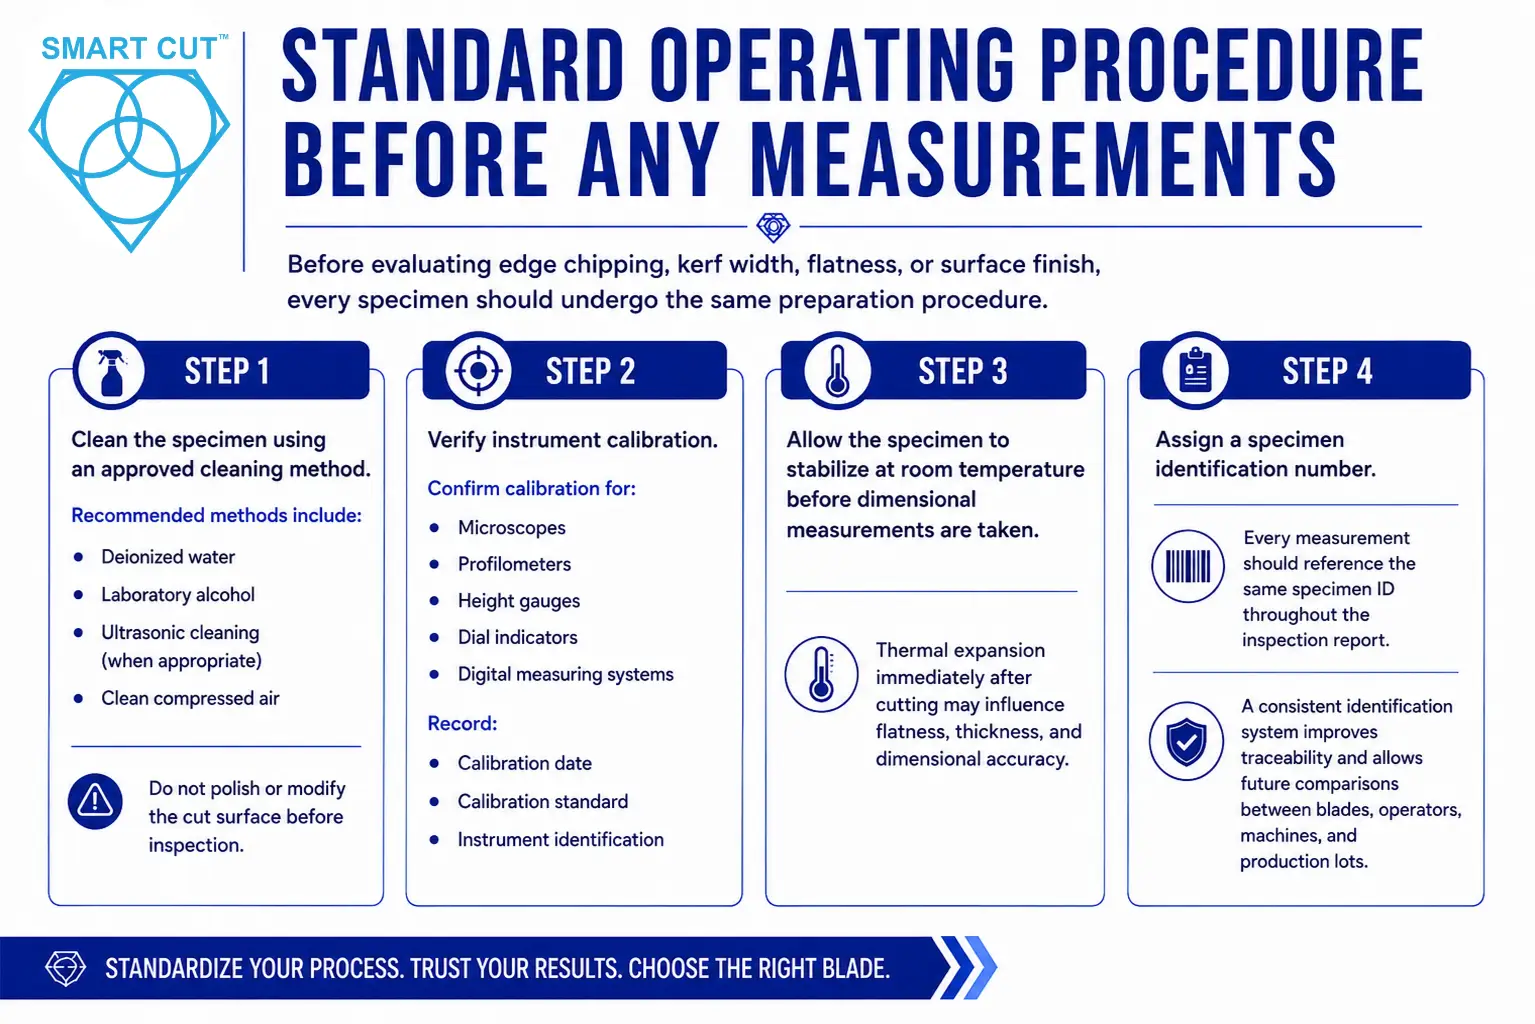
Before evaluating edge chipping, kerf width, flatness, or surface finish, every specimen should undergo the same preparation procedure.
Step 1
Clean the specimen using an approved cleaning method.
Recommended methods include:
● Deionized water
● Laboratory alcohol
● Ultrasonic cleaning (when appropriate)
● Clean compressed air
Do not polish or modify the cut surface before inspection.
Step 2
Verify instrument calibration.
Confirm calibration for:
● Microscopes
● Profilometers
● Height gauges
● Dial indicators
● Digital measuring systems
Record:
● Calibration date
● Calibration standard
● Instrument identification
Step 3
Allow the specimen to stabilize at room temperature before dimensional measurements are taken.
Thermal expansion immediately after cutting may influence flatness, thickness, and dimensional accuracy.
Step 4
Assign a specimen identification number.
Every measurement should reference the same specimen ID throughout the inspection report.
A consistent identification system improves traceability and allows future comparisons between blades, operators, machines, and production lots.
Standardized Procedure for Measuring Edge Chipping
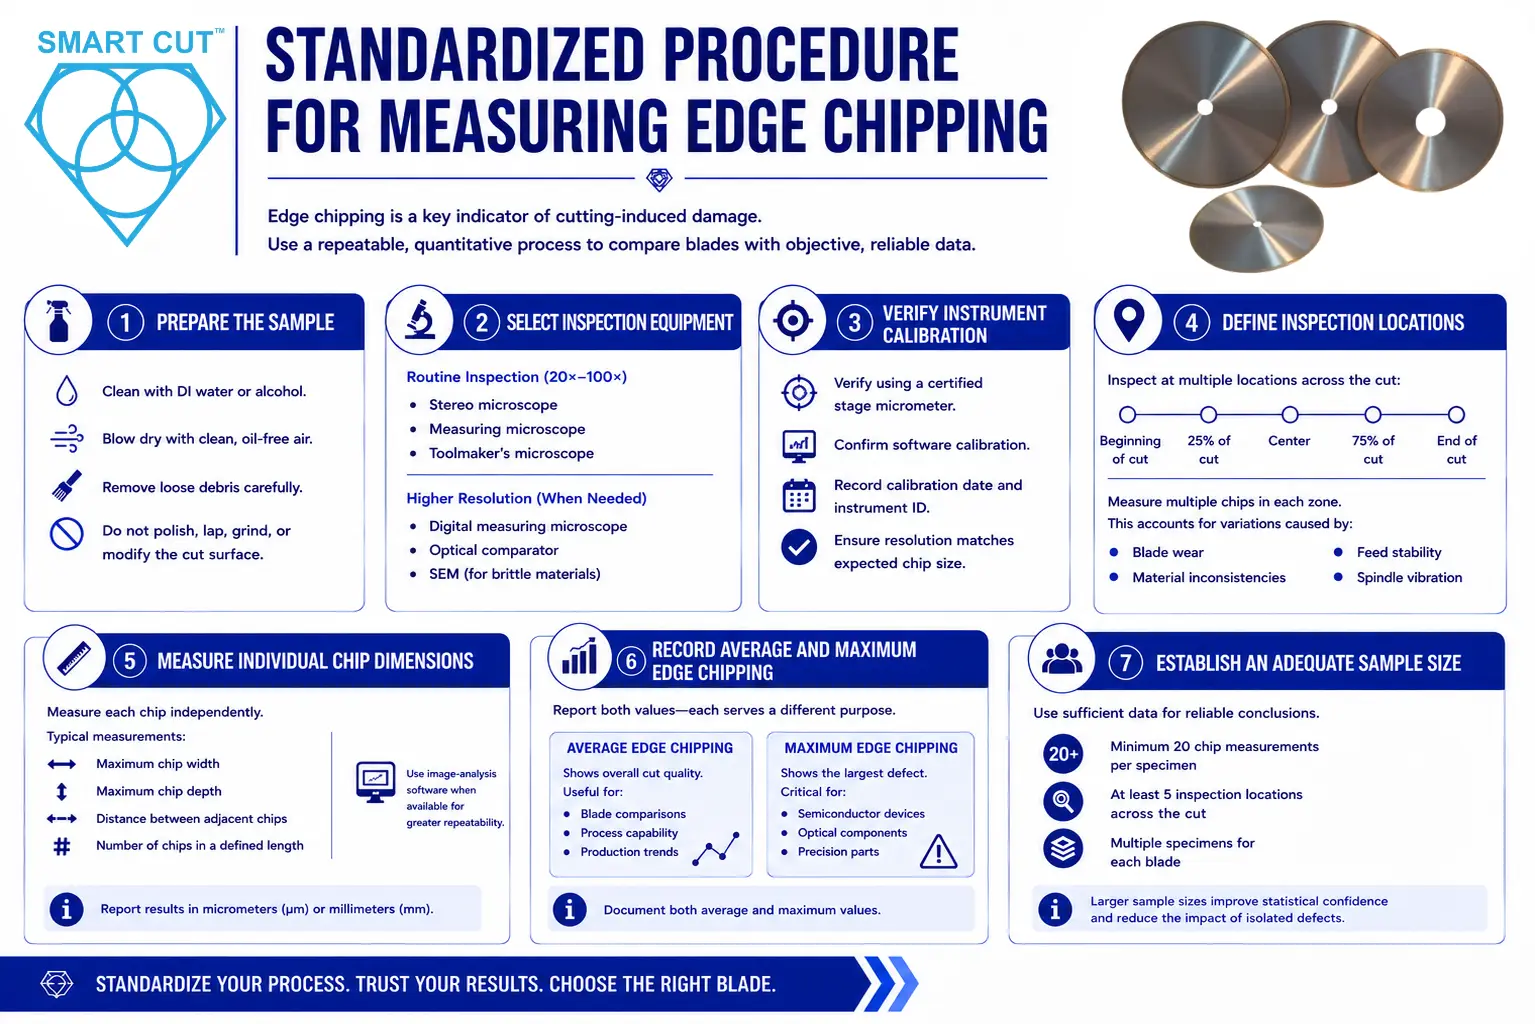
Edge chipping is one of the primary indicators of cutting-induced damage and is often the first characteristic engineers evaluate when comparing precision diamond blades. Even small chips along the cut edge can increase polishing time, reduce dimensional accuracy, initiate crack propagation, and compromise the integrity of brittle materials such as silicon, sapphire, alumina, glass, tungsten carbide, and advanced ceramics.
However, meaningful blade comparisons require more than observing whether one edge “looks cleaner” than another.
Edge chipping must be measured using a standardized inspection procedure that produces repeatable, quantitative data. Differences in microscope magnification, inspection location, sample preparation, or measurement technique can easily produce inconsistent results and lead to incorrect conclusions.
The objective is to establish a repeatable methodology that allows engineers to compare blade performance using objective measurements rather than subjective visual observations.
Step 1 — Prepare the Sample for Inspection
The specimen should be inspected in the same condition in which it left the cutting machine.
Before inspection:
● Remove coolant residue using deionized water or laboratory-grade alcohol.
● Blow the sample dry using clean, oil-free compressed air.
● Remove loose cutting debris without disturbing the edge.
● Do not polish, lap, grind, or otherwise modify the cut surface before measuring edge damage.
The purpose of the inspection is to evaluate the damage produced by the cutting operation—not damage remaining after secondary finishing processes.
Step 2 — Select the Appropriate Inspection Equipment
The required inspection equipment depends on the size of the expected defects and the material being evaluated.
Routine Production Inspection
Suitable equipment includes:
● Stereo microscope
● Measuring microscope
● Toolmaker’s microscope
Recommended magnification:
20×–100×
This range is generally sufficient for production quality control involving:
● Carbides
● Technical ceramics
● Glass
● Metallographic specimens
● Composite materials
Engineering and Failure Analysis
Higher-resolution equipment should be used when evaluating extremely brittle or high-value materials.
Recommended equipment includes:
● Digital measuring microscope
● Optical comparator
● Laser scanning microscope
● White-light interferometer
● Scanning Electron Microscope (SEM)
SEM inspection is particularly valuable for:
● Silicon wafers
● Sapphire
● Gallium Nitride (GaN)
● Silicon Carbide (SiC)
● Optical materials
These materials frequently develop microfractures that are difficult or impossible to detect using conventional optical microscopy.
Step 3 — Verify Instrument Calibration
Before collecting any measurements:
● Verify microscope calibration using a certified stage micrometer.
● Confirm the calibration of digital image analysis software.
● Record the calibration date and instrument identification number.
● Verify measurement resolution is appropriate for the expected chip size.
A measurement system that has not been calibrated cannot produce reliable comparison data, particularly when differences between competing blades may only be a few micrometers.
Step 4 — Define the Inspection Locations
Measuring only the largest visible chip does not represent overall cutting performance.
Instead, divide the cut edge into multiple inspection zones.
A recommended inspection pattern includes:
● Beginning of cut
● 25% of cut length
● Center
● 75% of cut length
● End of cut
Within each zone, measure multiple chips rather than selecting only the most severe defect.
This approach accounts for variations caused by:
● Blade wear
● Material inconsistencies
● Feed stability
● Spindle vibration
● Machine rigidity
Using identical inspection locations for every blade being compared significantly improves repeatability.
Step 5 — Measure Individual Chip Dimensions
Each measurable chip should be evaluated independently.
Typical measurements include:
● Maximum chip width
● Maximum chip depth
● Distance between adjacent chips
● Number of chips within a defined inspection length
Measurements should always be taken perpendicular to the original cut edge.
Where image-analysis software is available, digital measurement tools generally provide greater repeatability than manual measurements.
All measurements should be reported using consistent units, typically:
● Micrometers (µm)
● Millimeters (mm)
Micrometers are generally preferred for brittle materials because even small increases in edge damage may significantly affect downstream processing.
Step 6 — Record Both Average and Maximum Edge Chipping
Reporting only the largest chip provides little information about overall blade performance.
Likewise, reporting only the average chip size may hide isolated defects that exceed engineering tolerances.
Every inspection report should include both values.
Average Edge Chipping
Represents the overall quality of the cut edge and is useful for:
● Comparing blade specifications
● Process capability studies
● Production quality trends
Maximum Edge Chipping
Represents the largest defect produced during cutting and is particularly important for:
● Semiconductor devices
● Optical components
● Medical implants
● Precision ceramic parts
Many customer specifications define maximum allowable edge damage rather than average values.
Both measurements should therefore be documented.
Step 7 — Establish an Adequate Sample Size
Engineering conclusions should never be based on a single measurement.
For meaningful statistical comparison, measurements should include:
● A minimum of 20 individual chip measurements per specimen
● At least five inspection locations distributed across the cut
● Multiple specimens for each blade being evaluated
Larger sample sizes improve statistical confidence and reduce the influence of isolated defects.
For blade qualification programs, engineers may evaluate hundreds of individual measurements before finalizing performance comparisons.
Standardized Edge Chipping Inspection Report
| Inspection Location | Average Chip Size (µm) | Maximum Chip Size (µm) | Number of Chips Measured |
|---|---|---|---|
| Beginning of Cut | 8 | 15 | 20 |
| 25% Position | 9 | 17 | 20 |
| Center | 8 | 16 | 20 |
| 75% Position | 10 | 19 | 20 |
| End of Cut | 11 | 22 | 20 |
This reporting format allows engineers to determine not only the overall level of edge damage but also whether cutting performance changes throughout the life of the blade.
Common Measurement Errors
Edge-chipping evaluations frequently become unreliable because of inconsistent inspection practices.
Avoid the following mistakes:
● Measuring only the largest visible chip.
● Inspecting only one location along the cut.
● Comparing blades cut under different RPM, feed rates, or coolant conditions.
● Measuring after polishing or edge preparation.
● Using different microscope magnifications for different specimens.
● Failing to calibrate inspection equipment.
● Reporting only average values without maximum values.
● Comparing new blades with heavily worn blades without documenting blade life.
Any of these errors can invalidate a blade comparison and lead to incorrect engineering decisions.
Engineering Recommendation
Every manufacturing facility should establish a written Edge Chipping Standard Operating Procedure (SOP) that defines:
● Sample cleaning method
● Inspection equipment
● Magnification
● Calibration procedure
● Inspection locations
● Number of measurements
● Statistical reporting method
● Acceptance criteria
● Documentation format
Using a standardized procedure ensures that edge-chipping data remains repeatable across different operators, production shifts, machines, and future blade evaluations, allowing meaningful comparisons between blade specifications and cutting processes.
Kerf width is one of the most important—but frequently overlooked—performance indicators when evaluating precision diamond blades.
Many users assume the kerf is simply equal to the blade thickness. In practice, the actual kerf is influenced by multiple factors, including blade wear, spindle runout, machine rigidity, feed rate, material properties, blade deflection, and bond performance.
Two blades with the same nominal thickness may produce significantly different kerf widths under identical operating conditions.
For manufacturers processing expensive materials such as silicon, sapphire, gallium nitride, silicon carbide, tungsten carbide, optical glass, and advanced ceramics, even a 0.02–0.05 mm increase in kerf can translate into substantial material loss over thousands of cuts.
For this reason, kerf width should always be measured—not assumed.
What Should Be Measured?
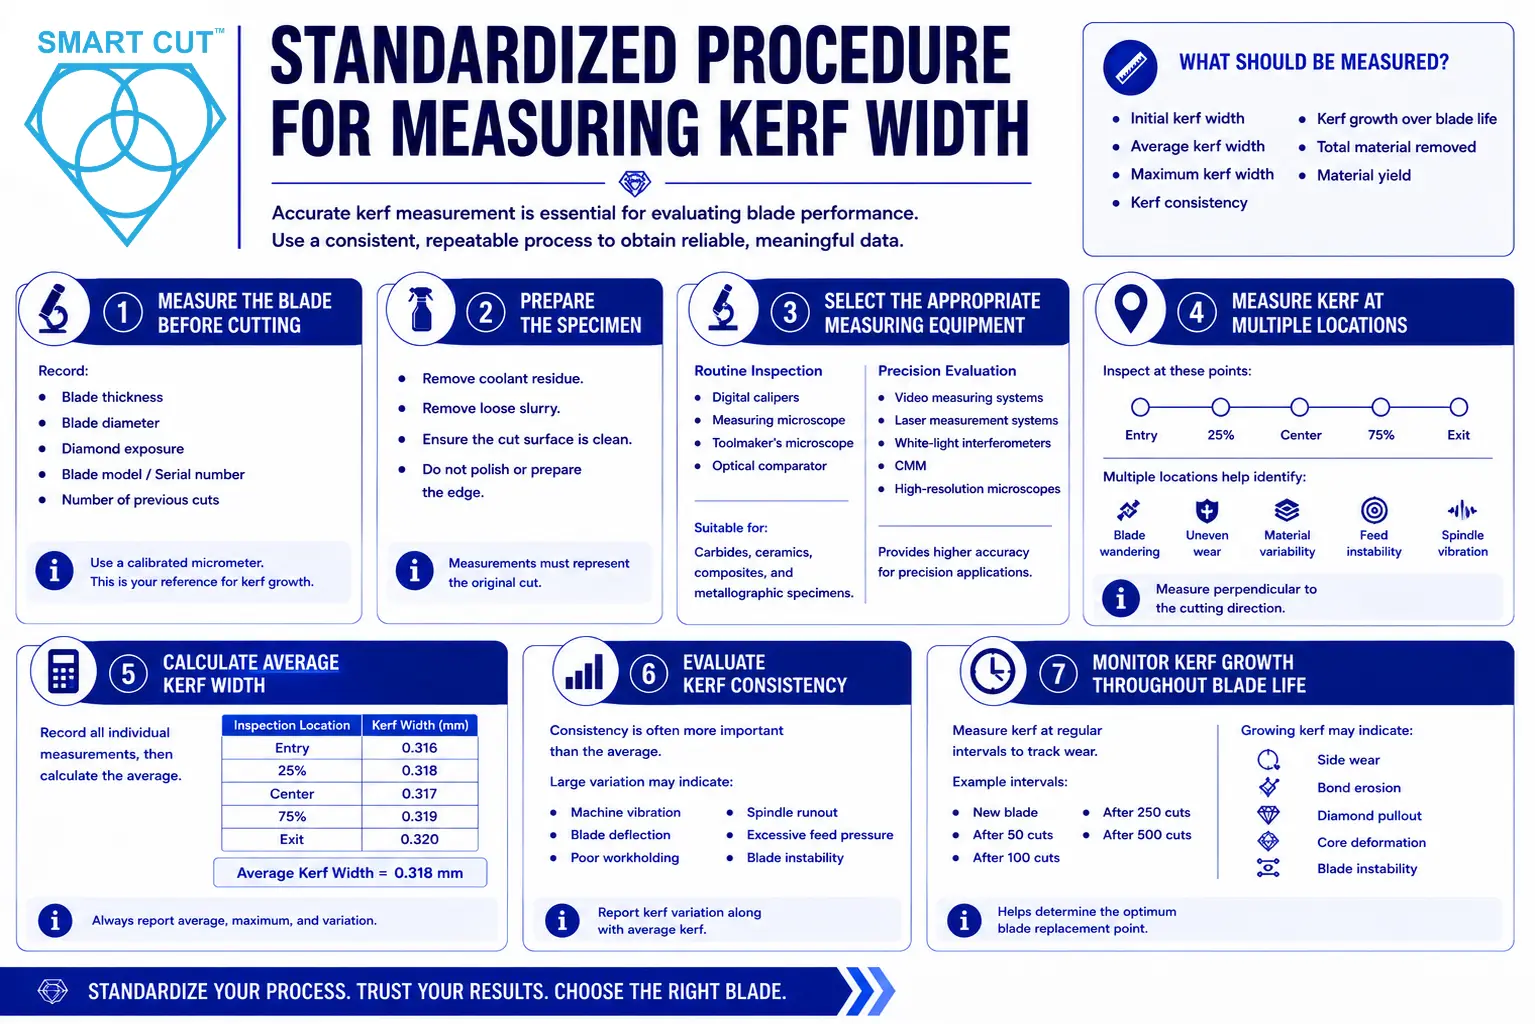
A complete kerf evaluation should include:
● Initial kerf width
● Average kerf width
● Maximum kerf width
● Kerf consistency
● Kerf growth throughout blade life
● Total material removed
● Material yield
Recording only a single kerf measurement provides limited engineering value and does not accurately represent blade performance.
Step 1 — Measure the Blade Before Cutting
Before making the first cut, document the blade itself.
Record:
● Blade thickness
● Blade diameter
● Diamond exposure
● Blade model
● Blade serial number (if available)
● Number of previous cuts
Measure blade thickness using a calibrated micrometer or digital thickness gauge.
The measured blade thickness provides a reference for evaluating kerf growth later in the blade’s life.
Step 2 — Prepare the Specimen
Before measuring kerf:
● Remove coolant residue.
● Remove loose slurry.
● Ensure the cut surface is clean.
● Avoid polishing or edge preparation before measurement.
Measurements should always represent the original cut produced by the blade.
Step 3 — Select the Appropriate Measuring Equipment
The required instrument depends on the required measurement accuracy.
Routine Production Inspection
Recommended equipment:
● Digital calipers
● Measuring microscope
● Toolmaker’s microscope
● Optical comparator
Suitable for:
● Carbides
● Ceramics
● Composite materials
● Metallographic specimens
Precision Engineering Evaluation
For laboratory testing and blade qualification:
● Video measuring systems
● Laser measurement systems
● White-light interferometers
● Coordinate Measuring Machines (CMM)
● High-resolution optical microscopes
These systems provide significantly greater repeatability when evaluating thin-kerf precision blades.
Step 4 — Measure Kerf at Multiple Locations
Kerf should never be measured at only one point.
Instead, measurements should be distributed along the complete cut.
Recommended inspection locations:
● Entry point
● 25% of cut length
● Center
● 75% of cut length
● Exit point
Additional measurements should be collected for long cuts or large workpieces.
Measuring multiple locations allows engineers to identify:
● Blade wandering
● Uneven wear
● Material variability
● Feed instability
● Spindle vibration
Every measurement should be taken perpendicular to the cutting direction.
Step 5 — Calculate Average Kerf Width
Record every individual measurement before calculating an average.
Example
| Inspection Location | Kerf Width |
|---|---|
| Entry | 0.316 mm |
| 25% | 0.318 mm |
| Center | 0.317 mm |
| 75% | 0.319 mm |
| Exit | 0.320 mm |
Average Kerf Width
= 0.318 mm
Average kerf provides an overall indication of cutting performance but should always be accompanied by maximum kerf and kerf variation.
Step 6 — Evaluate Kerf Consistency
Consistency is often more important than the average value.
A blade producing:
0.318 mm
throughout the entire cut generally performs better than a blade producing:
0.300 mm
at one location and
0.340 mm
at another.
Large kerf variation often indicates:
● Machine vibration
● Blade deflection
● Poor workholding
● Spindle runout
● Excessive feed pressure
● Blade instability
Kerf consistency should therefore be reported alongside average kerf.
Step 7 — Monitor Kerf Growth Throughout Blade Life
Kerf should be monitored throughout the blade’s service life rather than only when the blade is new.
As the blade wears, engineers should periodically repeat kerf measurements using the same inspection procedure.
Example inspection intervals may include:
● New blade
● After 50 cuts
● After 100 cuts
● After 250 cuts
● After 500 cuts
A growing kerf may indicate:
● Side wear
● Bond erosion
● Diamond pullout
● Blade instability
● Core deformation
Monitoring kerf growth helps determine the optimum blade replacement point rather than relying solely on blade age or operator judgment.
Example Kerf Growth Report
| Blade Condition | Average Kerf Width |
|---|---|
| New Blade | 0.318 mm |
| After 100 Cuts | 0.321 mm |
| After 250 Cuts | 0.325 mm |
| After 400 Cuts | 0.332 mm |
| After 500 Cuts | 0.338 mm |
Although the blade may continue cutting effectively, increasing kerf width gradually reduces material recovery and increases manufacturing cost.
Calculating Material Loss
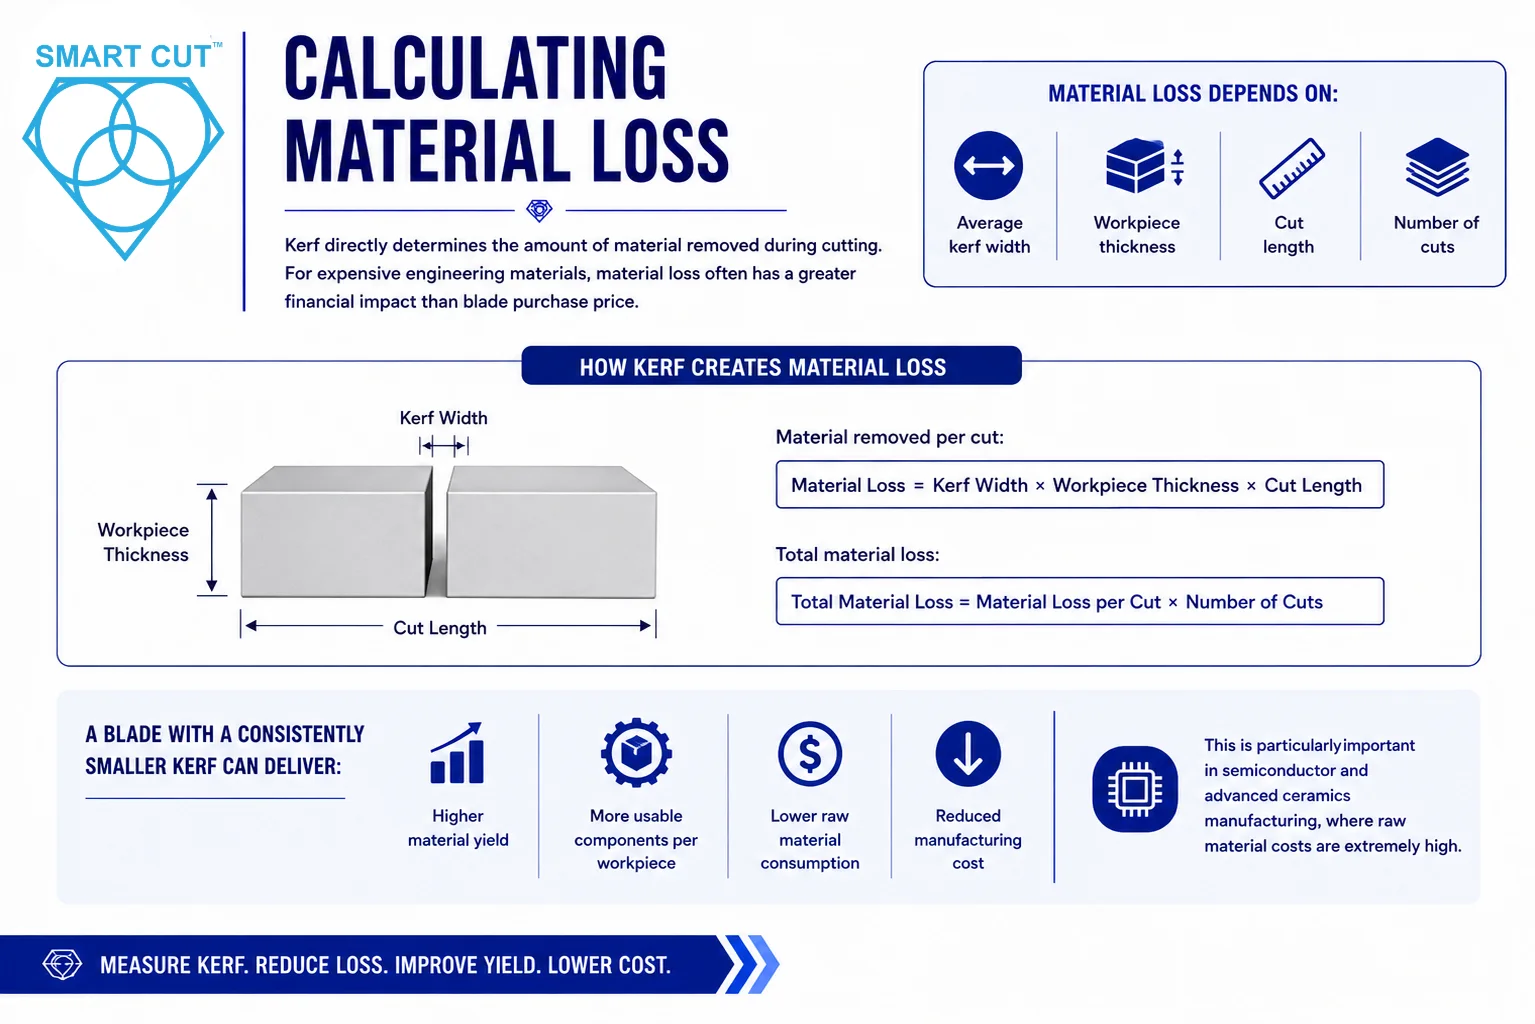
Kerf directly determines the amount of material removed during cutting.
For expensive engineering materials, material loss often has a greater financial impact than blade purchase price.
Material loss depends on:
● Average kerf width
● Workpiece thickness
● Cut length
● Number of cuts
When comparing blades, engineers should calculate the total material removed over the expected blade life.
A blade with a consistently smaller kerf can produce:
● Higher material yield
● More usable components per workpiece
● Lower raw material consumption
● Reduced manufacturing cost
This is particularly important in semiconductor and advanced ceramics manufacturing, where raw material costs are extremely high.
Standardized Kerf Inspection Report
Every engineering report should include:
● Blade thickness
● Average kerf width
● Maximum kerf width
● Kerf variation
● Number of measurements
● Inspection equipment
● Measurement uncertainty
● Number of cuts completed
● Material tested
● Cutting parameters used
Including this information ensures that future evaluations can be reproduced under identical conditions.
Common Measurement Errors
Kerf evaluations frequently produce misleading results because of inconsistent measurement practices.
Common mistakes include:
● Measuring only one location along the cut.
● Measuring near chipped edges instead of intact material.
● Comparing blades after different amounts of wear.
● Using different inspection equipment without calibration.
● Failing to document RPM, feed rate, or coolant conditions.
● Ignoring spindle runout or machine rigidity.
● Assuming blade thickness equals actual kerf.
These errors reduce the reliability of blade comparisons and can lead to incorrect conclusions regarding blade performance.
Engineering Recommendation
A standardized kerf measurement procedure should become part of every blade evaluation program.
The procedure should specify:
● Measurement equipment
● Calibration method
● Inspection locations
● Number of measurements
● Statistical reporting method
● Blade inspection intervals
● Material-loss calculations
● Acceptance criteria
When kerf width is monitored throughout the blade’s life, manufacturers gain valuable insight into blade wear, process stability, material utilization, and overall production efficiency. Combined with edge-chipping measurements, kerf analysis provides a strong foundation for selecting the most economical blade based on measurable engineering performance rather than purchase price alone.
Standardized Procedure for Measuring:
Flatness, Parallelism, Thickness Variation, Surface Roughness, and Subsurface Damage
While edge chipping and kerf width indicate how a blade performs during cutting, they do not fully describe the quality of the finished specimen.
For many precision cutting applications, the final component must also satisfy strict geometric and surface quality requirements before it can proceed to grinding, polishing, assembly, microscopy, failure analysis, or dimensional inspection.
A blade that produces minimal chipping may still generate:
● Uneven cut surfaces
● Thickness variation
● Blade wander
● Poor surface finish
● Subsurface microcracking
● Heat-affected zones
For this reason, a complete blade evaluation should include measurements of:
● Flatness
● Parallelism
● Thickness variation
● Subsurface damage
These measurements provide engineers with a complete picture of blade performance rather than relying on a single quality indicator.
Measuring Flatness
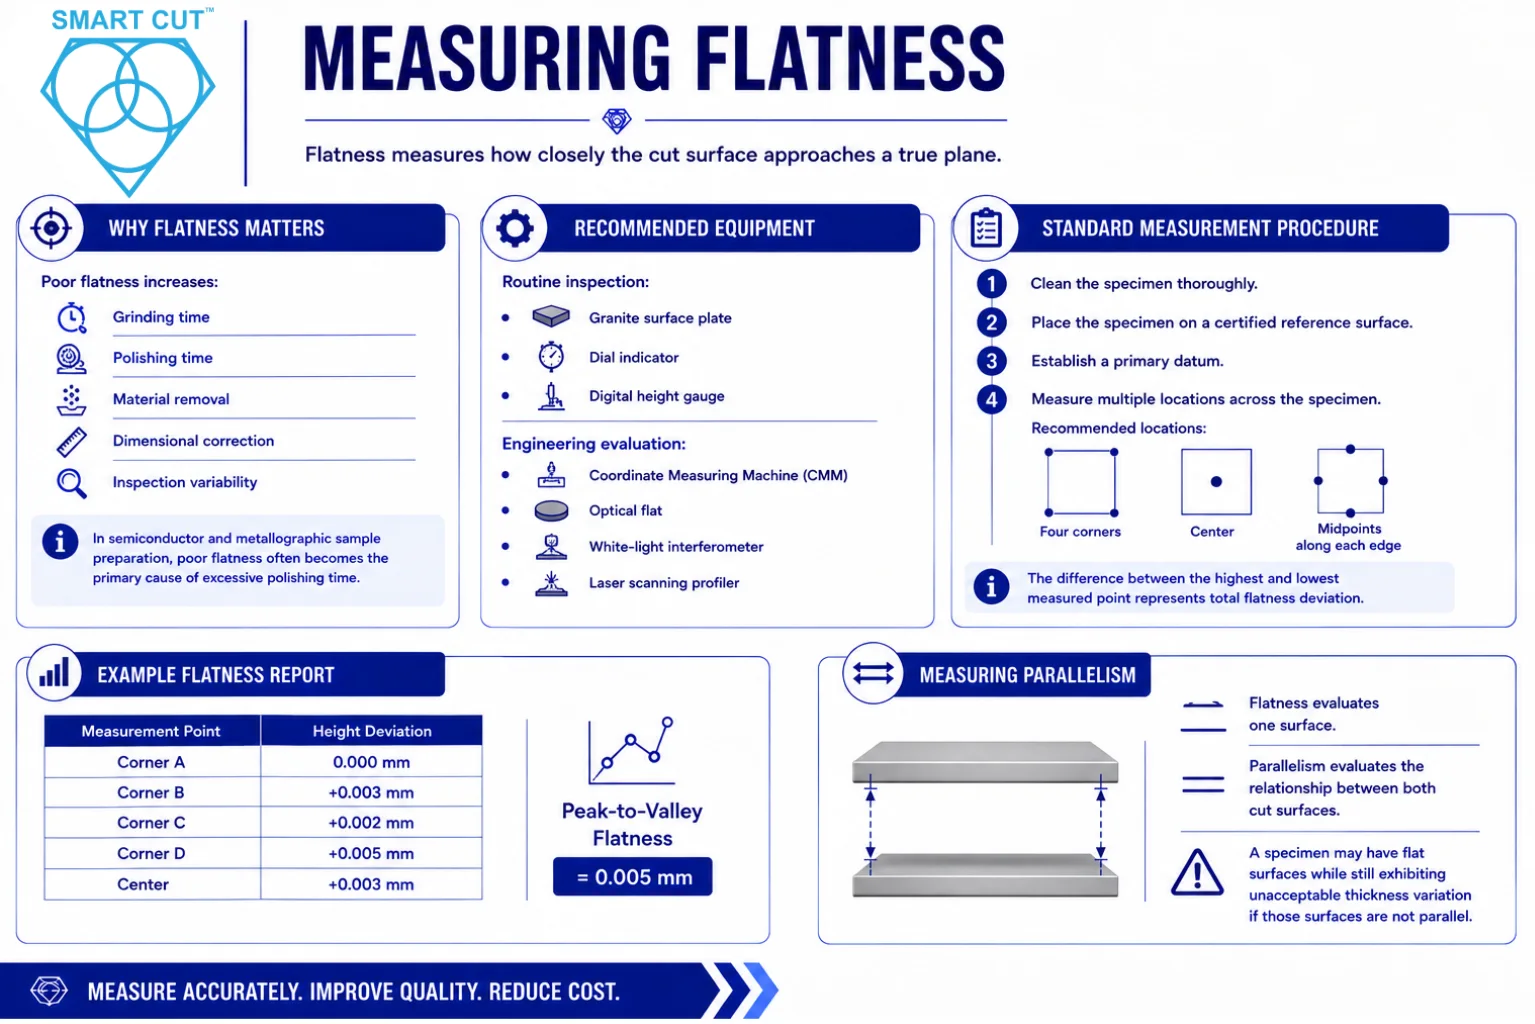
Why Flatness Matters
Flatness measures how closely the cut surface approaches a true plane.
Poor flatness increases:
● Grinding time
● Polishing time
● Material removal
● Dimensional correction
● Inspection variability
In semiconductor and metallographic sample preparation, poor flatness often becomes the primary cause of excessive polishing time.
Recommended Equipment
Routine inspection:
● Granite surface plate
● Dial indicator
● Digital height gauge
Engineering evaluation:
● Coordinate Measuring Machine (CMM)
● Optical flat
● White-light interferometer
● Laser scanning profiler
Standard Measurement Procedure
1. Clean the specimen thoroughly.
2. Place the specimen on a certified reference surface.
3. Establish a primary datum.
4. Measure multiple locations across the specimen.
Recommended locations:
● Four corners
● Center
● Midpoints along each edge
The difference between the highest and lowest measured point represents total flatness deviation.
Example Flatness Report
| Measurement Point | Height Deviation |
|---|---|
| Corner A | 0.000 mm |
| Corner B | +0.003 mm |
| Corner C | +0.002 mm |
| Corner D | +0.005 mm |
| Center | +0.003 mm |
Peak-to-Valley Flatness
= 0.005 mm
Measuring Parallelism
Flatness evaluates one surface.
Parallelism evaluates the relationship between both cut surfaces.
A specimen may have flat surfaces while still exhibiting unacceptable thickness variation if those surfaces are not parallel.
Standard Procedure
| Location | Thickness |
|---|---|
| Corner A | 10.001 mm |
| Corner B | 10.003 mm |
| Corner C | 10.002 mm |
| Corner D | 10.005 mm |
| Center | 10.003 mm |
Measuring Thickness Variation
Rather than reporting only average thickness, engineers should evaluate thickness distribution across the entire specimen.
Thickness mapping helps identify:
● Blade deflection
● Machine vibration
● Uneven feed pressure
● Fixture instability
● Material movement
Large specimens should include additional measurement points to improve statistical confidence.
Measuring Surface Roughness
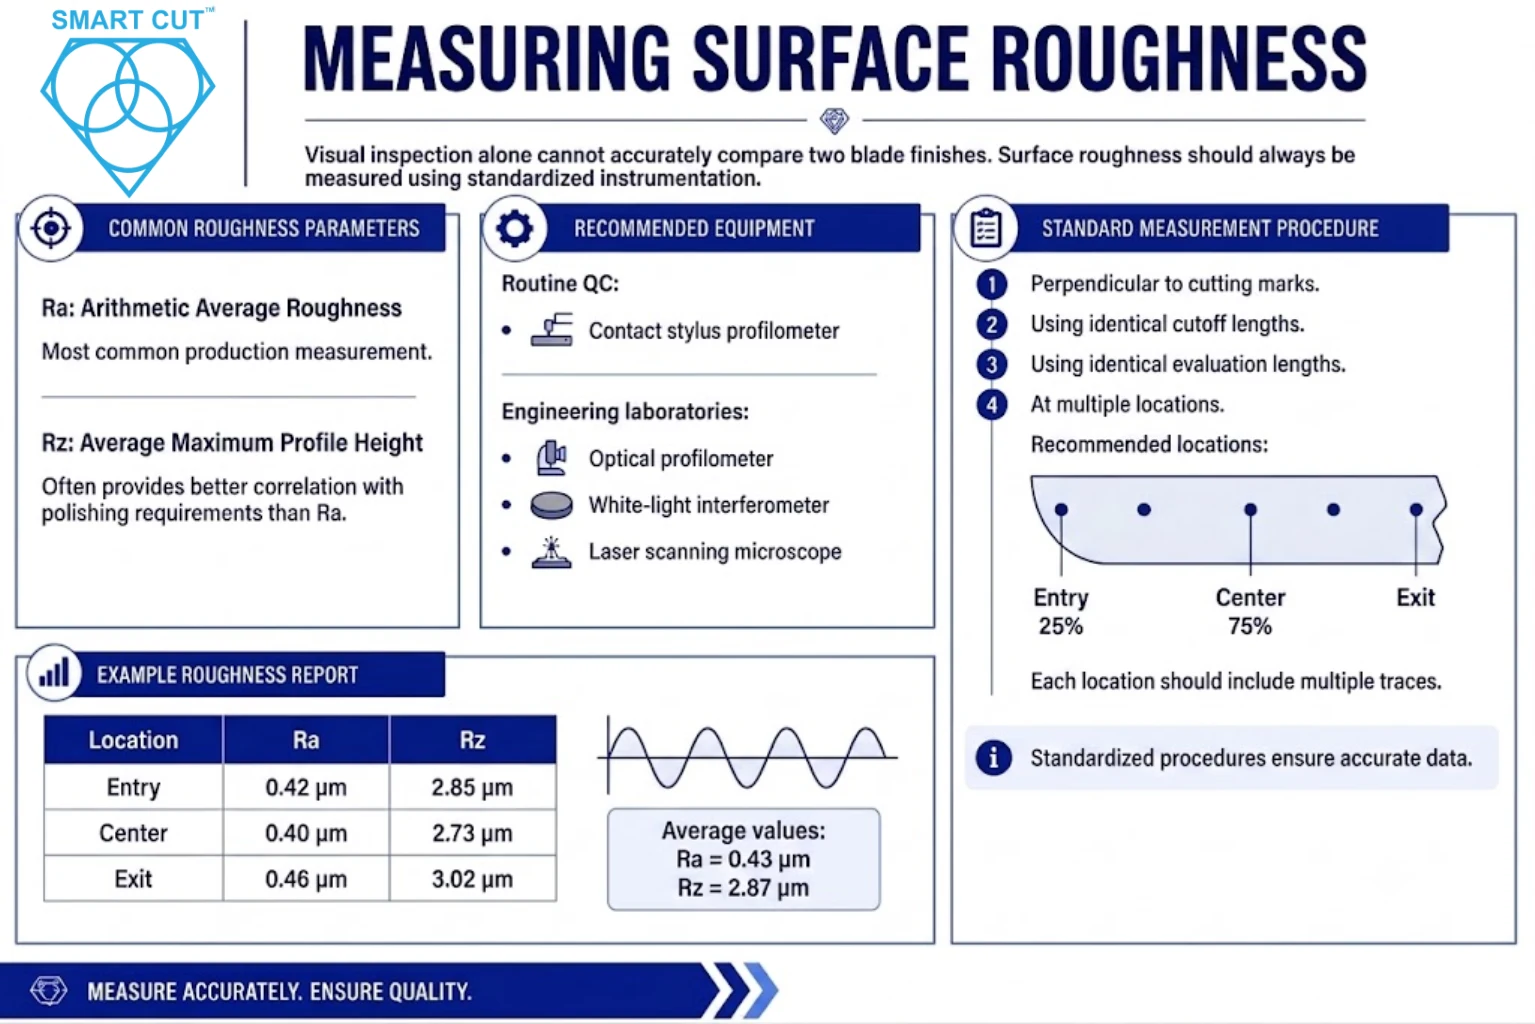
Visual inspection alone cannot accurately compare two blade finishes.
Surface roughness should always be measured using standardized instrumentation.
Common Roughness Parameters
Ra
Arithmetic Average Roughness
Most common production measurement.
Rz
Average Maximum Profile Height
Often provides better correlation with polishing requirements than Ra.
Recommended Equipment
Routine QC
● Contact stylus profilometer
Engineering laboratories
● Optical profilometer
● White-light interferometer
● Laser scanning microscope
Standard Measurement Procedure
Measurements should always be taken:
● Perpendicular to cutting marks
● Using identical cutoff lengths
● Using identical evaluation lengths
● At multiple locations
Recommended locations:
● Entry
● 25%
● Center
● 75%
● Exit
Each location should include multiple traces.
Example Roughness Report
| Location | Ra | Rz |
|---|---|---|
| Entry | 0.42 µm | 2.85 µm |
| Center | 0.40 µm | 2.73 µm |
| Exit | 0.46 µm | 3.02 µm |
Average values:
Ra = 0.43 µm
Rz = 2.87 µm
Measuring Subsurface Damage
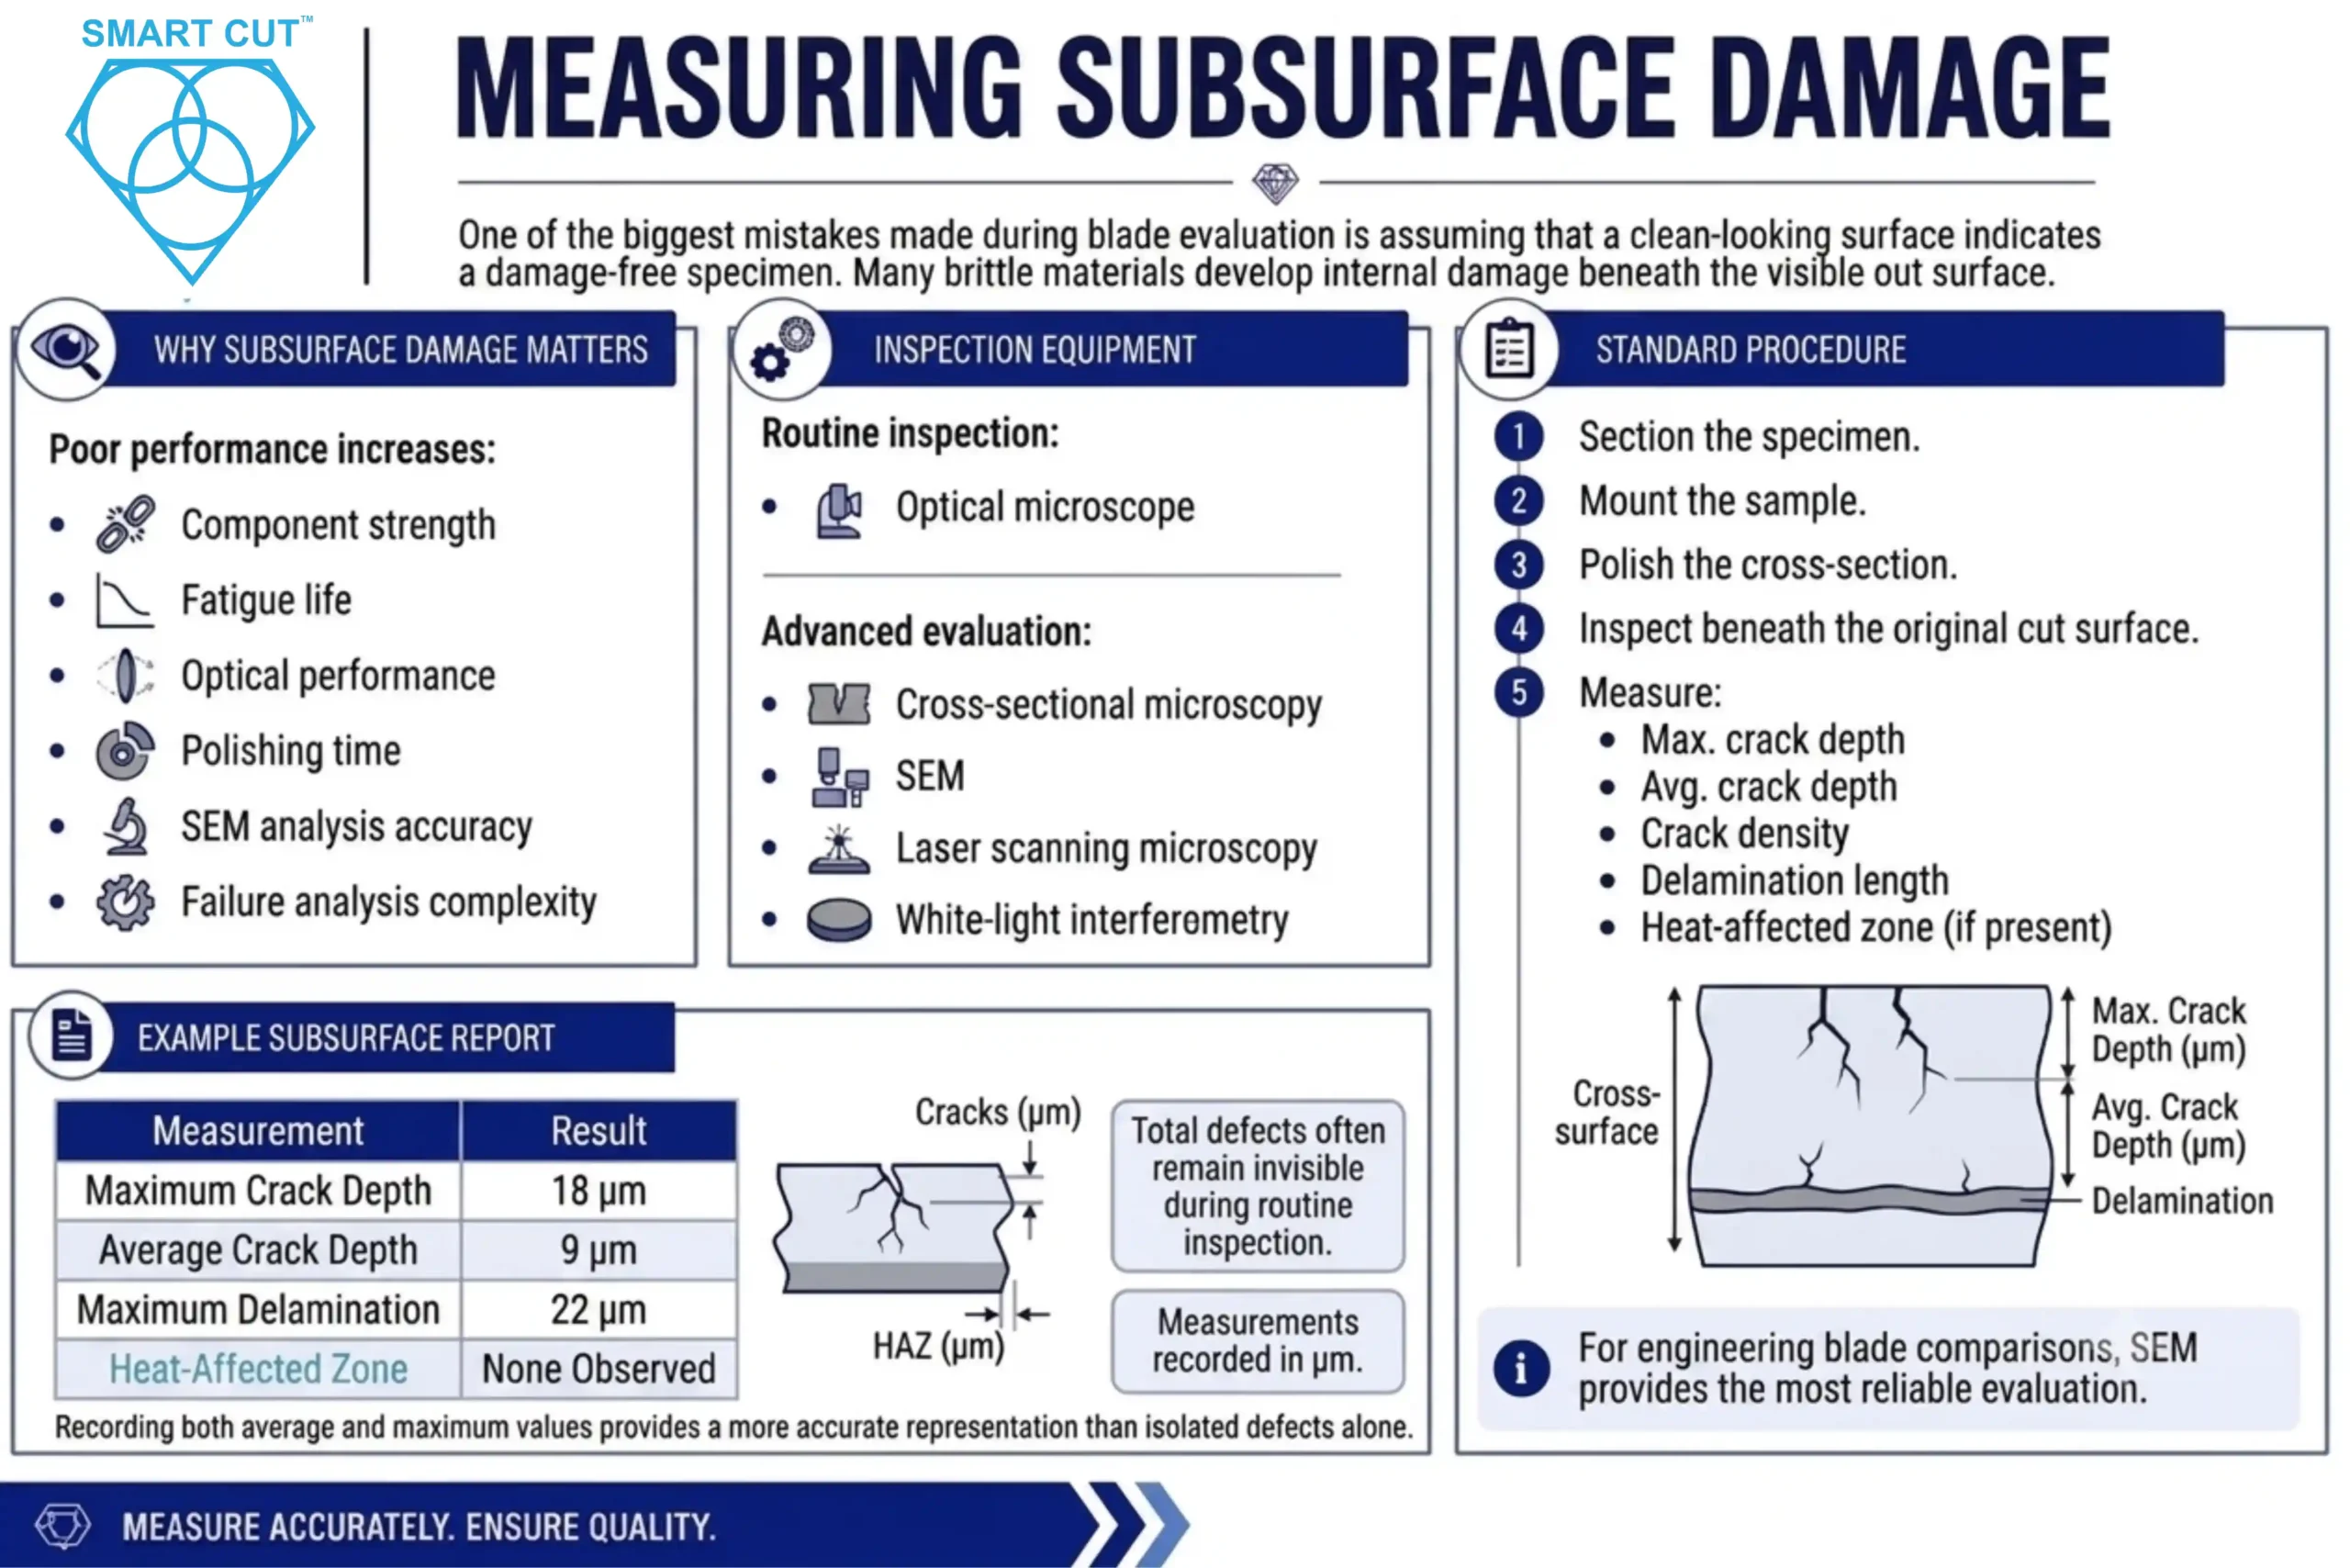
One of the biggest mistakes made during blade evaluation is assuming that a clean-looking surface indicates a damage-free specimen.
Many brittle materials develop internal damage beneath the visible cut surface.
Examples include:
● Microcracks
● Lateral cracks
● Grain pull-out
● Delamination
● Thermal damage
● Fracture propagation
These defects often remain invisible during routine inspection.
Why Subsurface Damage Matters
Subsurface damage affects:
● Component strength
● Fatigue life
● Optical performance
● Polishing time
● SEM analysis
● Failure analysis accuracy
For semiconductor packages and advanced ceramics, subsurface damage frequently becomes the limiting factor for acceptable cut quality.
Inspection Equipment
Routine inspection:
● Optical microscope
Advanced evaluation:
● Cross-sectional microscopy
● SEM
● Laser scanning microscopy
● White-light interferometry
For engineering blade comparisons, SEM provides the most reliable evaluation of crack propagation and fracture depth.
Standard Procedure
1. Section the specimen.
2. Mount the sample.
3. Polish the cross-section.
4. Inspect beneath the original cut surface.
5. Measure:
● Maximum crack depth
● Average crack depth
● Crack density
● Delamination length
● Heat-affected zone (if present)
Measurements should be recorded in micrometers.
Example Report
| Measurement | Result |
|---|---|
| Maximum Crack Depth | 18 µm |
| Average Crack Depth | 9 µm |
| Maximum Delamination | 22 µm |
| Heat-Affected Zone | None Observed |
Recording both average and maximum values provides a more accurate representation of blade performance than reporting isolated defects alone.
Engineering Interpretation
None of these measurements should be evaluated independently.
For example:
Blade A may produce:
● Lowest Ra
● Lowest kerf
but also:
● Highest subsurface cracking
● Poor flatness
Blade B may produce:
● Slightly higher roughness
while providing:
● Better dimensional accuracy
● Lower polishing time
● Better material yield
● Longer blade life
The best blade is rarely the one with the lowest value for a single parameter.
It is the blade that provides the best balance of:
● Edge quality
● Dimensional accuracy
● Surface finish
● Material preservation
● Process consistency
● Total manufacturing cost
Engineering Recommendation
Every blade qualification program should establish standardized procedures for:
● Flatness measurement
● Parallelism inspection
● Thickness mapping
● Surface roughness evaluation
● Subsurface damage analysis
Using identical inspection procedures across every blade evaluation ensures meaningful comparisons between blade specifications while improving process repeatability and reducing operator-dependent variation.
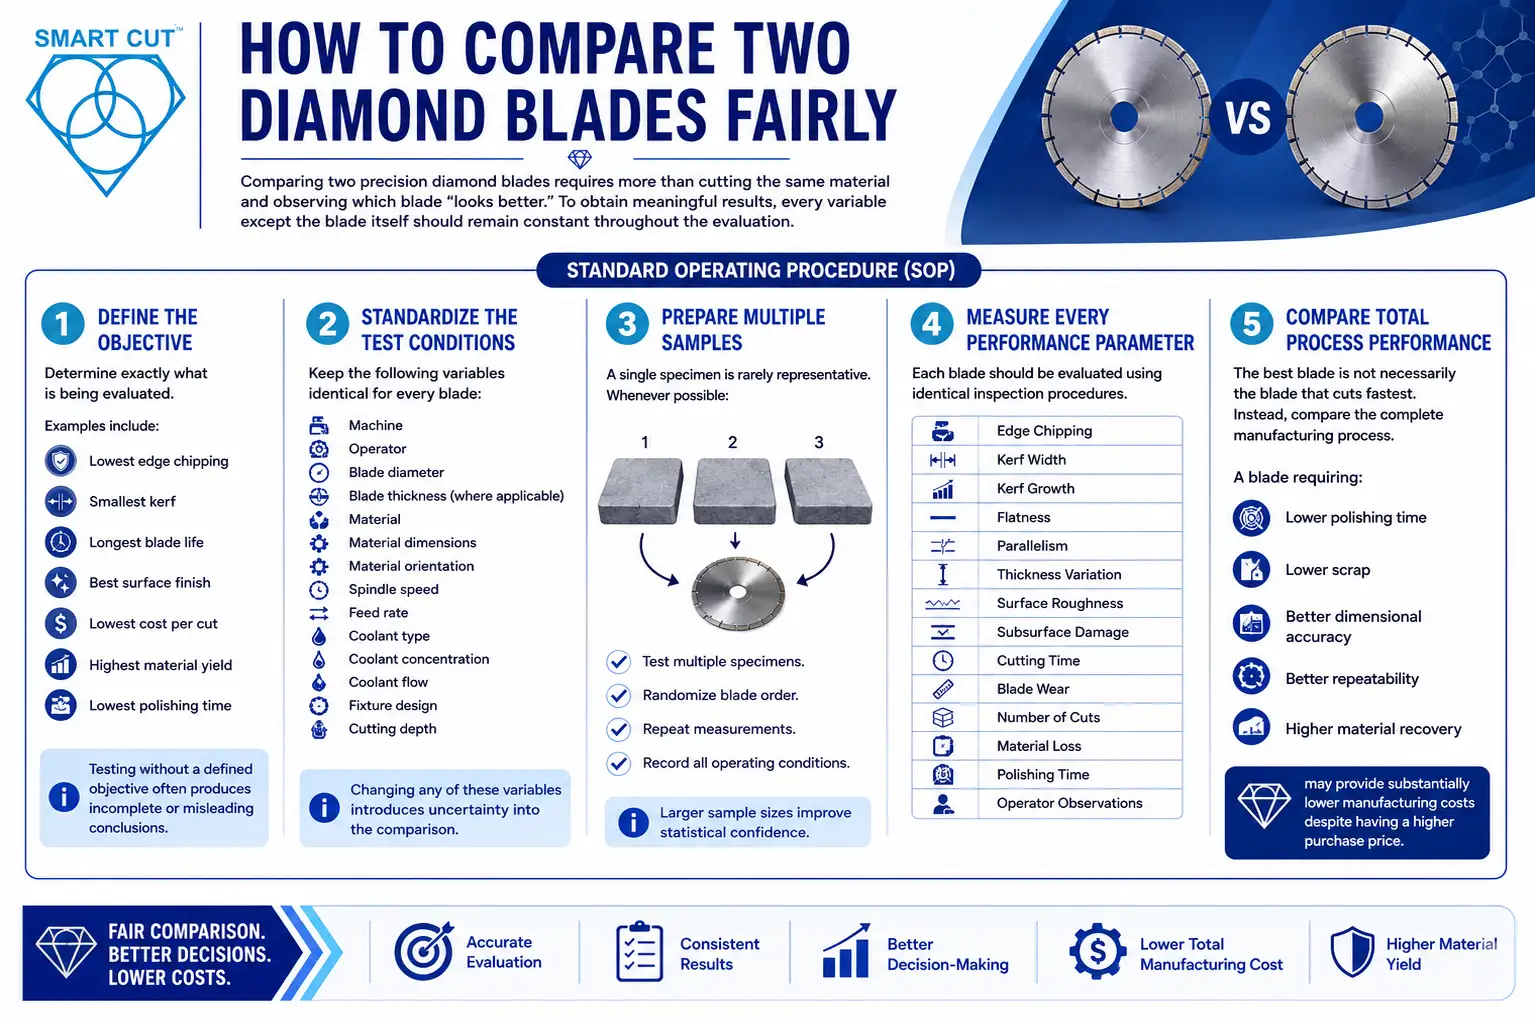
Comparing two precision diamond blades requires more than cutting the same material and observing which blade “looks better.”
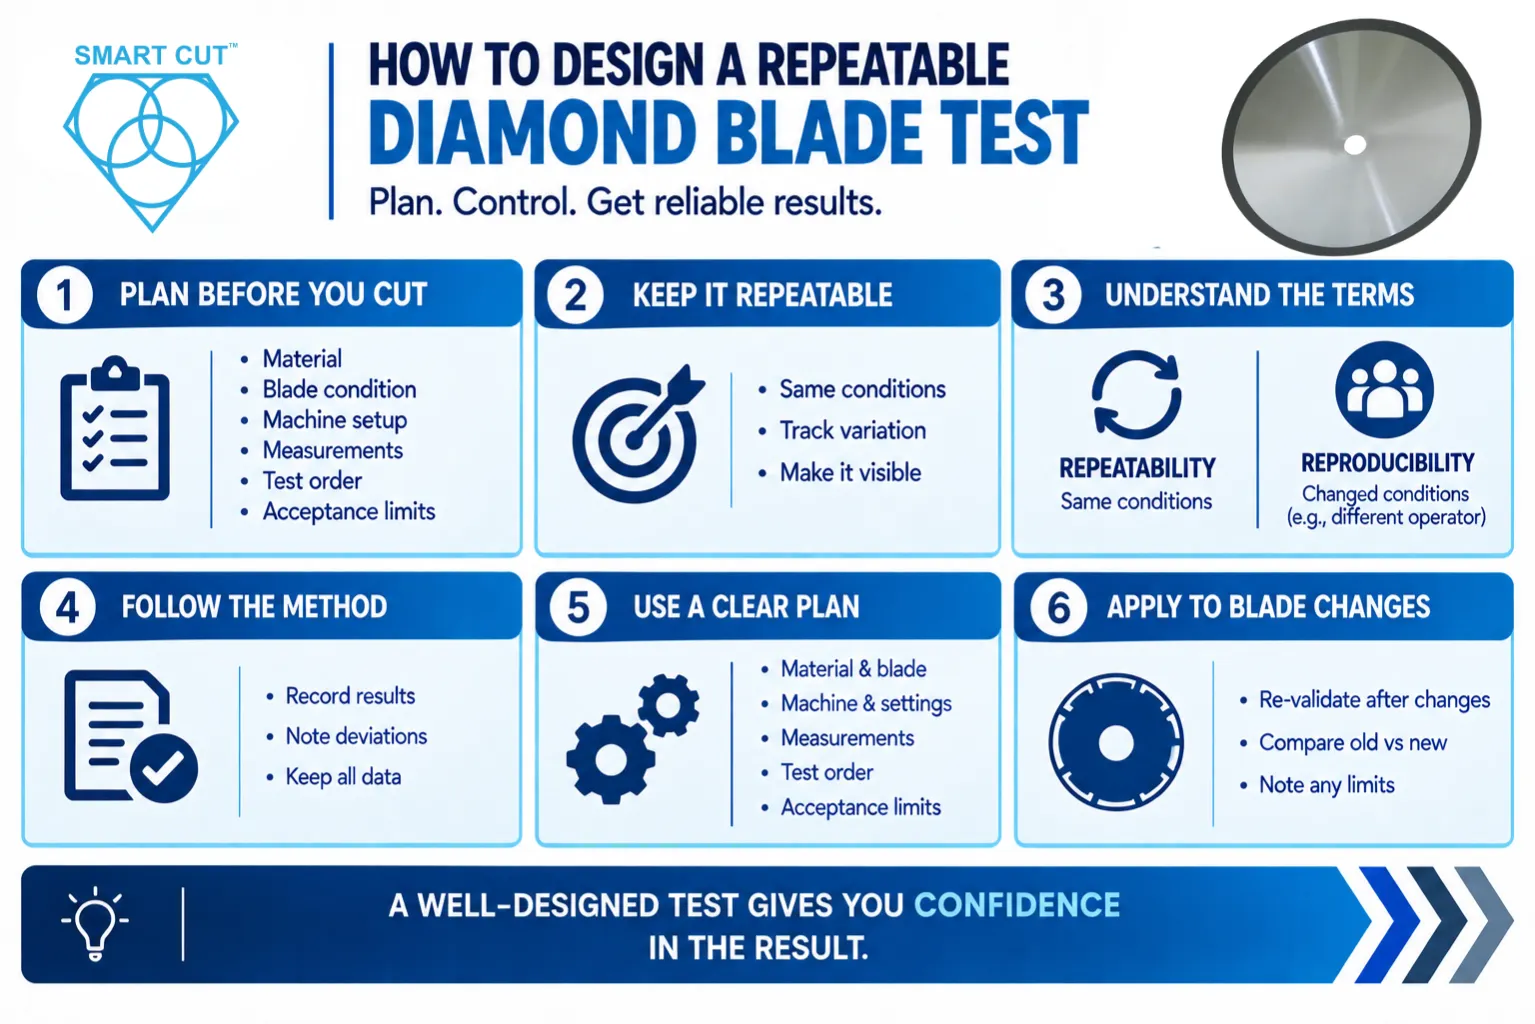
To obtain meaningful results, every variable except the blade itself should remain constant throughout the evaluation.
Standard Operating Procedure (SOP)
Step 1 – Define the Objective
Determine exactly what is being evaluated.
Examples include:
● Lowest edge chipping
● Smallest kerf
● Longest blade life
● Best surface finish
● Lowest cost per cut
● Highest material yield
● Lowest polishing time
Testing without a defined objective often produces incomplete or misleading conclusions.
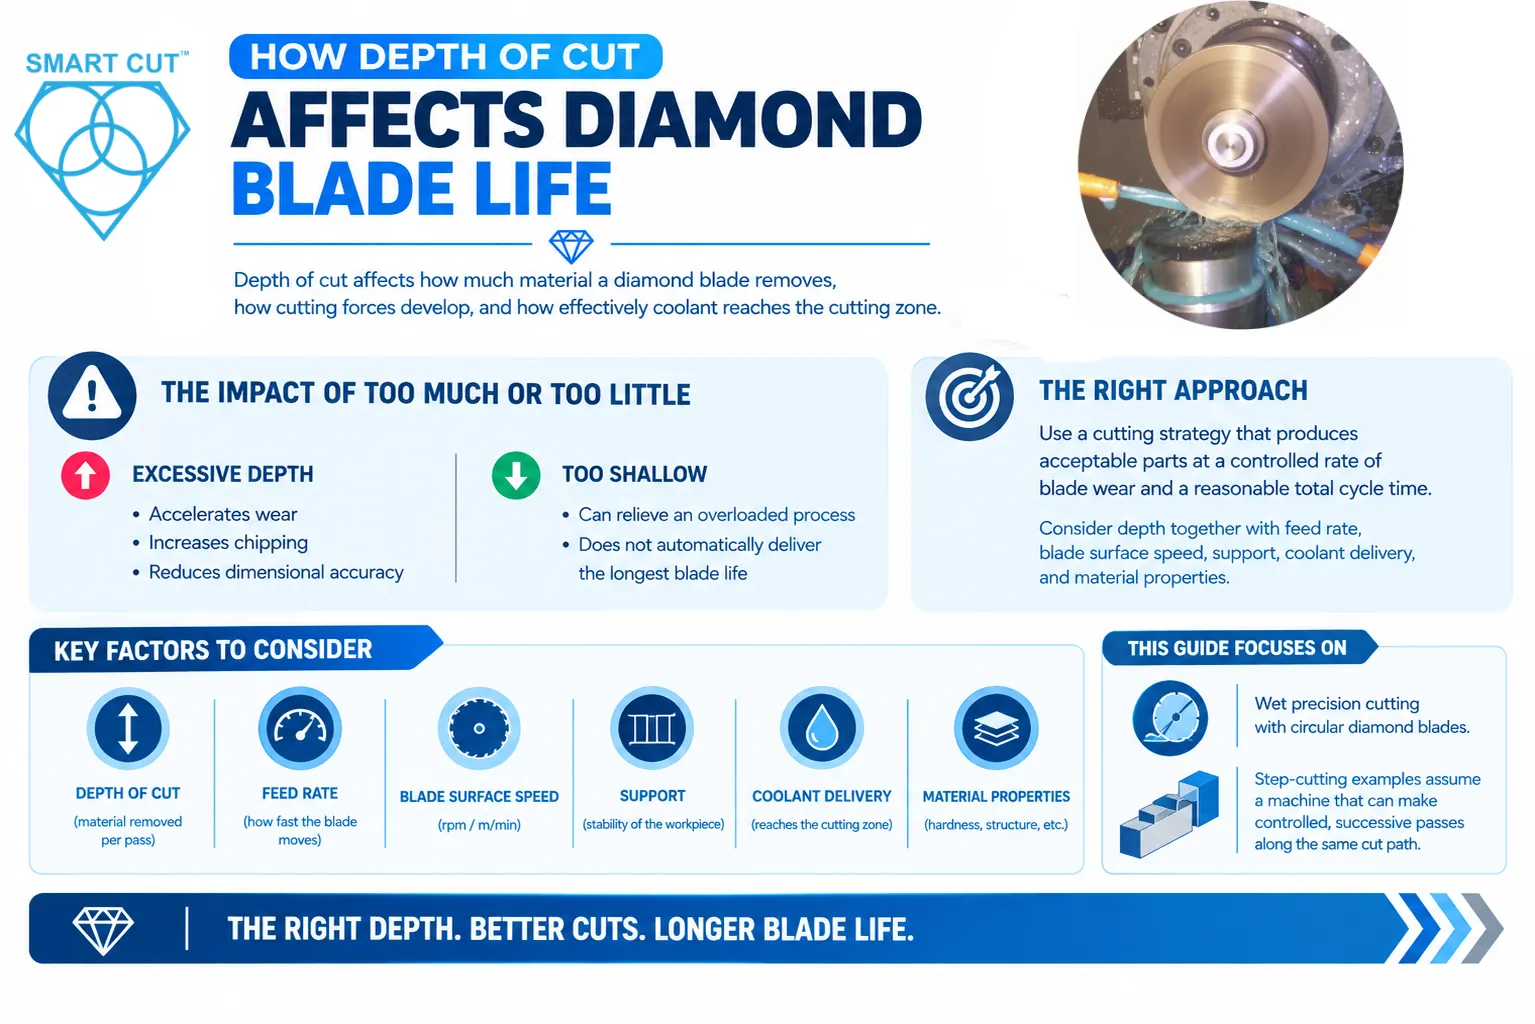
Step 2 – Standardize the Test Conditions
Keep the following variables identical for every blade:
● Machine
● Operator
● Blade diameter
● Blade thickness (where applicable)
● Material
● Material dimensions
● Material orientation
● Feed rate
● Coolant type
● Coolant concentration
● Coolant flow
● Fixture design
● Cutting depth
Changing any of these variables introduces uncertainty into the comparison.
Step 3 – Prepare Multiple Samples
A single specimen is rarely representative.
Whenever possible:
● Test multiple specimens.
● Randomize blade order.
● Repeat measurements.
● Record all operating conditions.
Larger sample sizes improve statistical confidence.
Step 4 – Measure Every Performance Parameter
Each blade should be evaluated using identical inspection procedures.
Record:
✓ Edge Chipping
✓ Kerf Width
✓ Kerf Growth
✓ Flatness
✓ Parallelism
✓ Thickness Variation
✓ Surface Roughness
✓ Subsurface Damage
✓ Cutting Time
✓ Blade Wear
✓ Number of Cuts
✓ Material Loss
✓ Polishing Time
✓ Operator Observations
Step 5 – Compare Total Process Performance
The best blade is not necessarily the blade that cuts fastest.
Instead, compare the complete manufacturing process.
A blade requiring:
● Lower polishing time
● Lower scrap
● Better dimensional accuracy
● Better repeatability
● Higher material recovery
may provide substantially lower manufacturing costs despite having a higher purchase price.
| Problem | Likely Cause | Recommended Action |
|---|---|---|
| Excessive edge chipping | Feed rate too high | Reduce feed and verify blade specification |
| Blade wandering | Machine vibration or blade deflection | Inspect spindle runout and improve workholding |
| Increasing kerf width | Blade wear | Monitor blade life and replace at established wear limits |
| Poor flatness | Machine instability | Improve fixture rigidity and reduce cutting force |
| High surface roughness | Incorrect blade specification | Optimize grit size, bond, RPM, and feed rate |
| Subsurface cracking | Excessive cutting forces | Reduce feed rate, improve coolant delivery, and verify blade selection |
| Rapid blade wear | Incorrect bond or operating parameters | Review blade specification and cutting conditions |
| Poor repeatability | Inconsistent operating conditions | Standardize machine setup and inspection procedures |
Troubleshooting should always begin with the complete cutting system rather than assuming the blade is solely responsible.
Material-Specific Testing Considerations
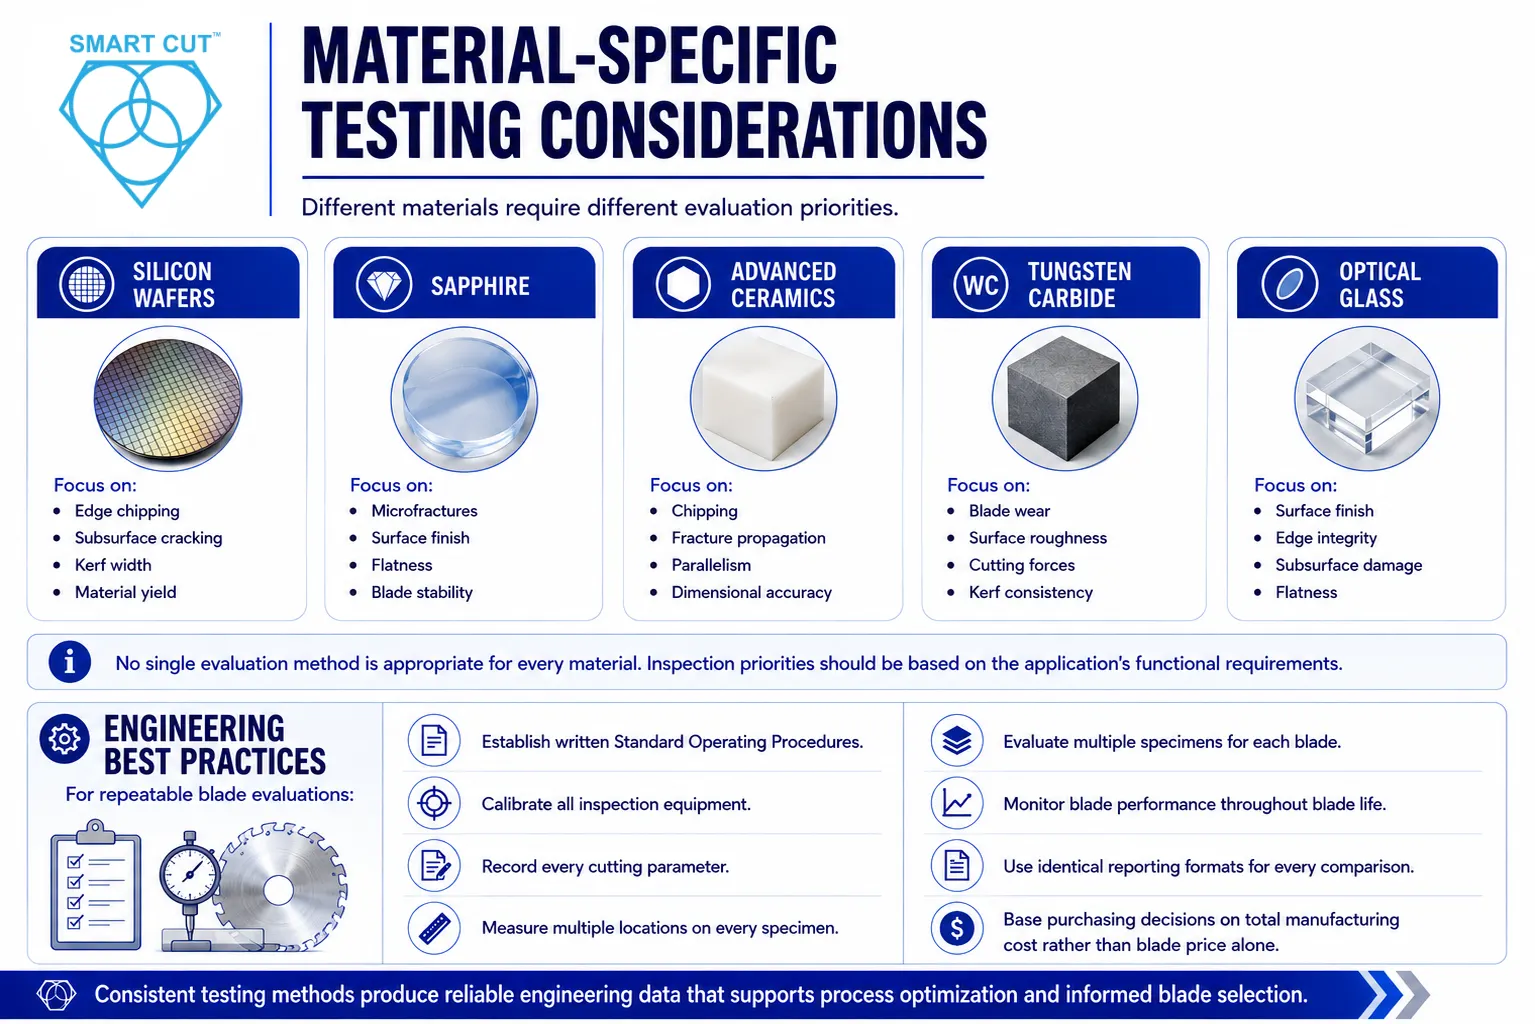
Different materials require different evaluation priorities.
Silicon Wafers
Focus on:
● Edge chipping
● Subsurface cracking
● Kerf width
● Material yield
Sapphire
Focus on:
● Microfractures
● Surface finish
● Flatness
● Blade stability
Advanced Ceramics
Focus on:
● Chipping
● Fracture propagation
● Parallelism
● Dimensional accuracy
Tungsten Carbide
Focus on:
● Blade wear
● Cutting forces
● Kerf consistency
Optical Glass
Focus on:
● Surface finish
● Edge integrity
● Flatness
No single evaluation method is appropriate for every material.
Inspection priorities should be based on the application’s functional requirements.
Engineering Best Practices
For repeatable blade evaluations:
● Establish written Standard Operating Procedures.
● Calibrate all inspection equipment.
● Record every cutting parameter.
● Measure multiple locations on every specimen.
● Evaluate multiple specimens for each blade.
● Monitor blade performance throughout blade life.
● Use identical reporting formats for every comparison.
● Base purchasing decisions on total manufacturing cost rather than blade price alone.
Consistent testing methods produce reliable engineering data that supports process optimization and informed blade selection.
Frequently Asked Questions
There is no single measurement that defines blade performance. A complete evaluation should include edge chipping, kerf width, flatness, surface roughness, subsurface damage, material loss, blade wear, and total cost per cut.
One specimen is rarely sufficient. Multiple specimens tested under identical operating conditions provide statistically meaningful comparisons and improve confidence in the results.
Kerf may increase because of side wear, bond erosion, diamond pullout, blade deflection, or machine instability. Monitoring kerf growth helps establish optimal blade replacement intervals.
A smooth surface may still contain subsurface cracks, poor flatness, excessive kerf, or unacceptable dimensional variation. Surface roughness should always be evaluated alongside other cut-quality measurements.
No. While standardized inspection methods improve consistency, the relative importance of each measurement varies by material and application. Semiconductor wafers, optical glass, advanced ceramics, and carbide components each require different evaluation priorities.
Precision diamond blade evaluation should never rely on visual inspection or subjective impressions alone.
Objective measurements—including edge chipping, kerf width, flatness, parallelism, surface roughness, subsurface damage, and material loss—provide the engineering data necessary to compare blade performance accurately and optimize cutting processes.
By implementing standardized testing procedures, manufacturers can reduce process variability, improve dimensional accuracy, increase material yield, minimize polishing requirements, and make blade selection decisions based on measurable performance rather than purchase price.
Whether evaluating a new blade specification, qualifying a supplier, troubleshooting production issues, or improving process capability, a disciplined and repeatable inspection methodology provides the foundation for meaningful comparisons and continuous process improvement.
Trusted by Tens of Thousands of Manufacturers, Laboratories,
Research Institutions Worldwide Since 1990
American Based Manufacturer
Established in 1990
Custom manufacturing
RELATED ARTICLES