





















Diamond Blade Cost per Cut: How to Calculate the True Cost per Good Part

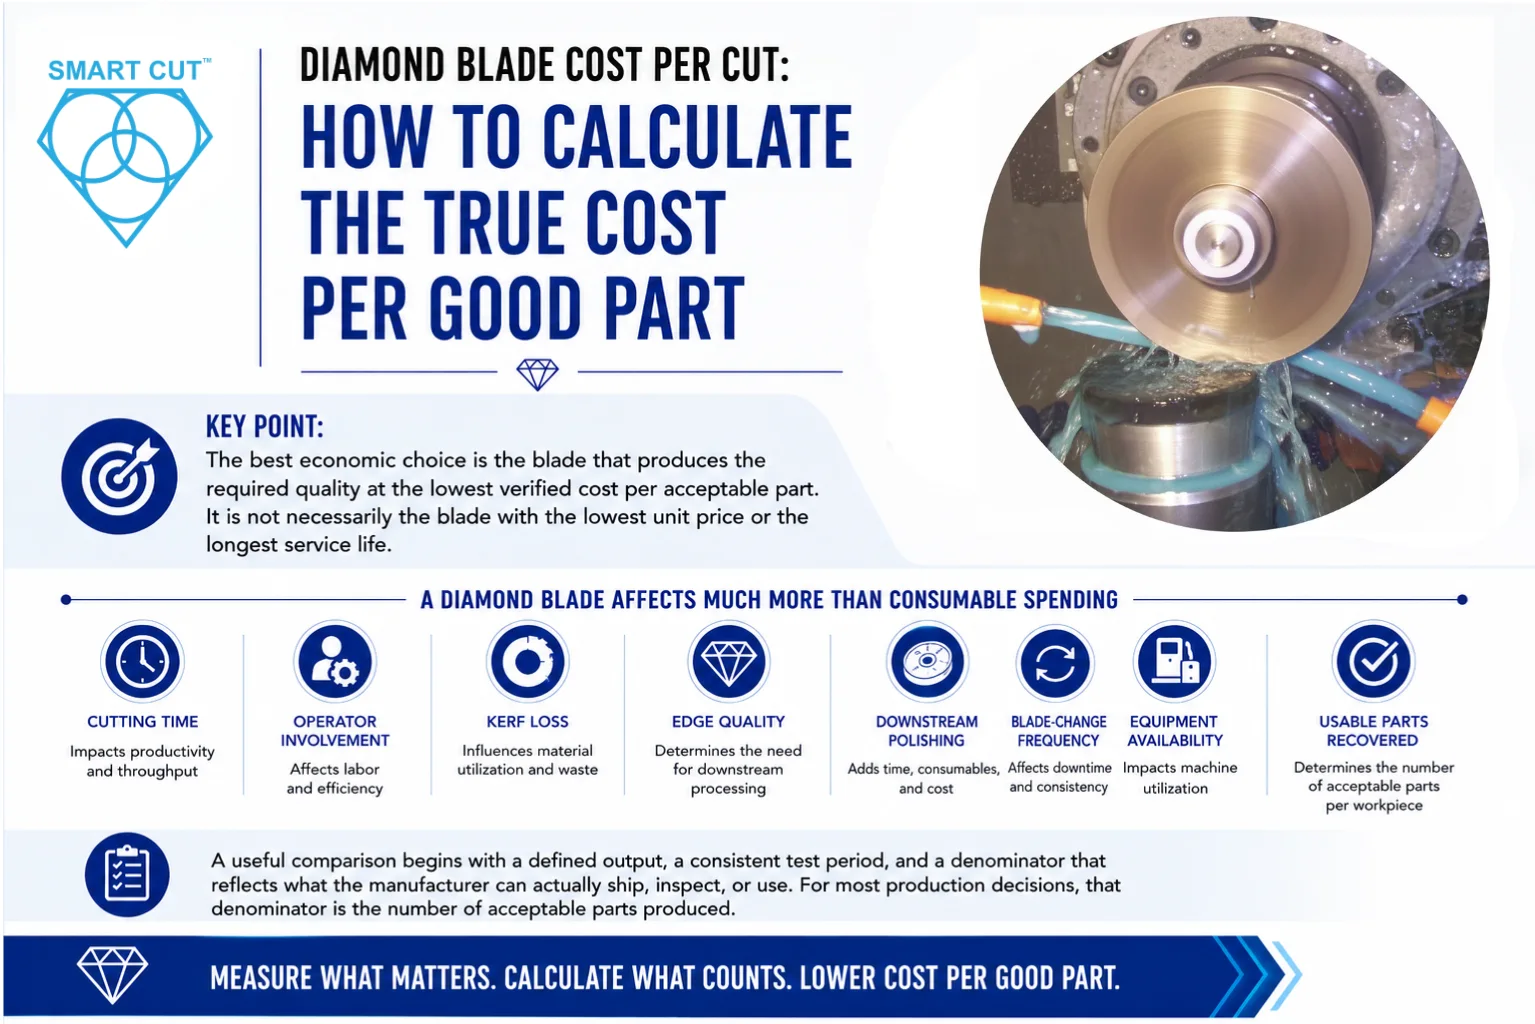
Table of Contents
ToggleKey point: The best economic choice is the blade that produces the required quality at the lowest verified cost per acceptable part. It is not necessarily the blade with the lowest unit price or the longest service life.
A diamond blade affects much more than consumable spending. It influences cutting time, operator involvement, kerf loss, edge quality, downstream polishing, blade-change frequency, equipment availability, and the number of usable parts recovered from each workpiece. These effects can outweigh a difference in blade purchase price, especially when the material or the machine time is expensive.
A useful comparison therefore begins with a defined output, a consistent test period, and a denominator that reflects what the manufacturer can actually ship, inspect, or use. For most production decisions, that denominator is the number of acceptable parts produced.
Trusted by Tens of Thousands of Manufacturers, Laboratories Research Institutions Worldwide Since 1990

American Based Manufacturer

Established in 1990


Custom manufacturing


Start with the Correct Metric
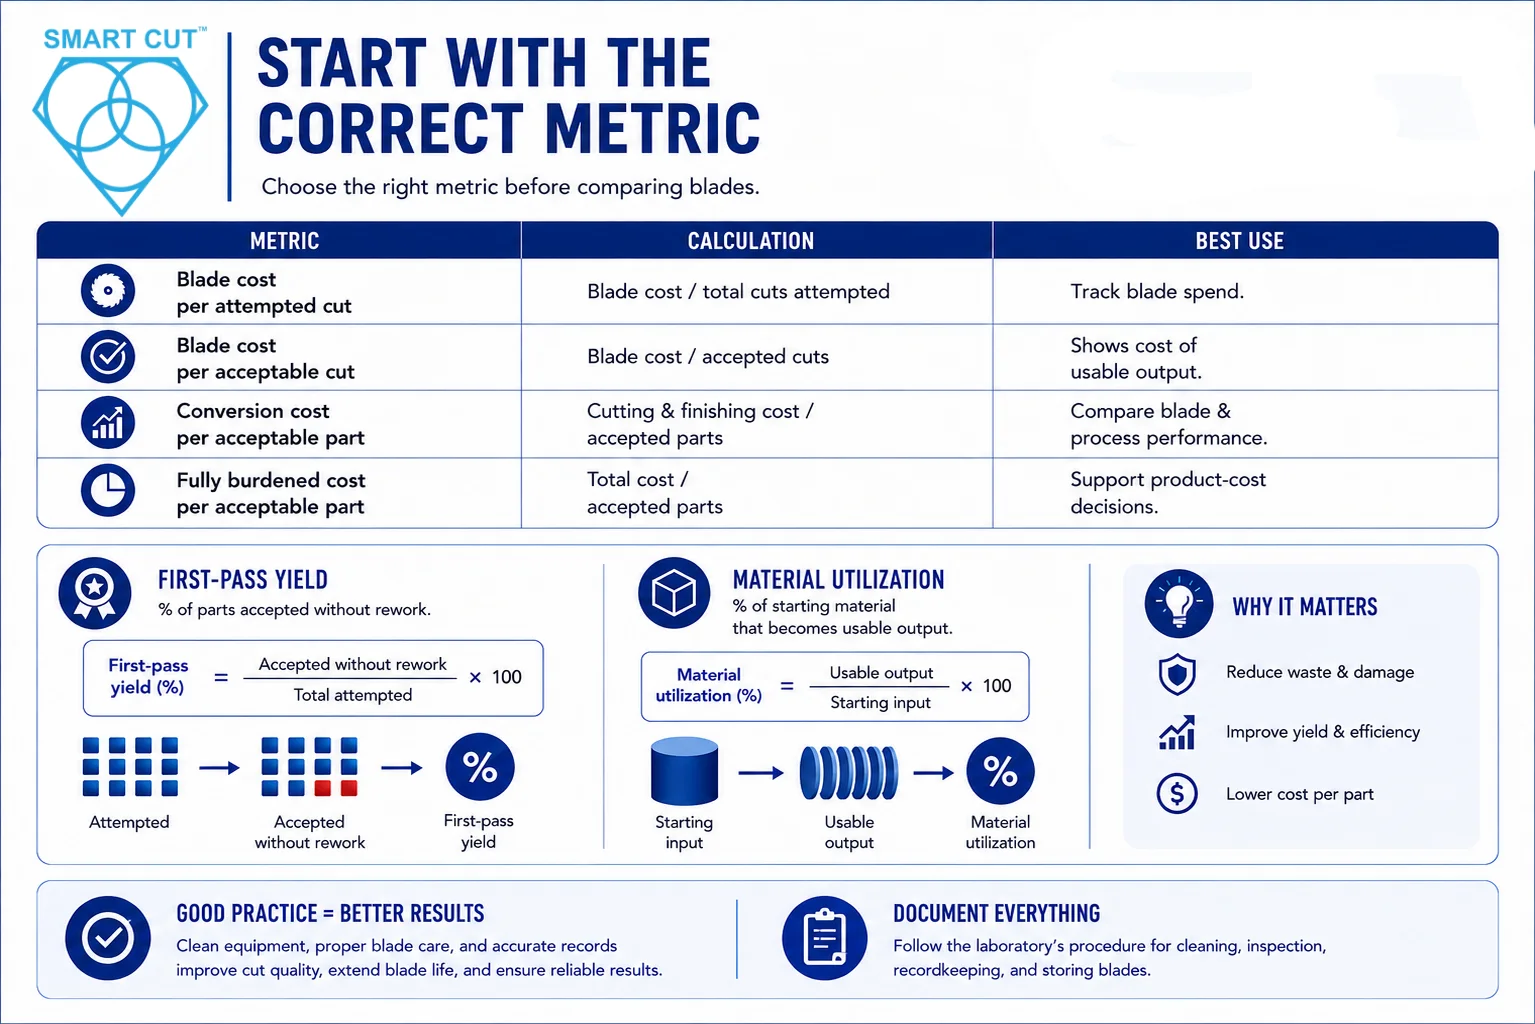
The phrase cost per cut is often used loosely. Before comparing two blades, define what the calculation measures. The following metrics answer different questions.
| Metric | Calculation | Best use |
|---|---|---|
| Blade cost per attempted cut | Blade cost consumed / total cuts attempted | Tracks blade consumption without adjusting for rejects. |
| Blade cost per acceptable cut | Blade cost consumed / accepted cuts | Shows the blade expense assigned to usable output. |
| Conversion cost per acceptable part | Attributable cutting and finishing costs / accepted parts | Compares the manufacturing effect of competing blade and process combinations. |
| Fully burdened cost per acceptable part | Direct material, conversion, failure, and allocated overhead costs / accepted parts | Supports broader product-cost and profitability decisions. |
First-pass yield and material utilization are different
First-pass yield measures quality output. It is the percentage of attempted parts accepted without rework.
First-pass yield (%) = Accepted parts without rework / total attempted parts x 100
Material utilization (%) = Usable output / starting material input x 100
Use a Consistent Cost Model
Calculate all costs over the same test period or production batch. Use actual consumed resources for that period and divide them by the accepted output from the same period.
Conversion cost per acceptable part = (blade cost consumed + productive machine cost + direct labor + coolant and dressing + attributable setup and downtime + downstream finishing + inspection and rework + incremental material loss + other quality costs) / accepted parts
If the objective is to calculate the fully burdened cost of the product, include the complete direct-material input and any overhead required by the company’s accounting method. If the objective is only to compare blade alternatives, call the result blade-related conversion cost per acceptable part and include the costs that can reasonably change with blade performance.
Rules that prevent misleading results
• Use the same test period, batch, and acceptance criteria for every blade.
• Use blade cost consumed during the test, not only the price of one unopened blade.
• Include the cost of rejected attempts in the batch numerator, then divide by accepted output.
• Separate productive machine time from blade-change, setup, cleaning, and troubleshooting time.
• Confirm what is already included in the machine rate and burdened labor rate.
• Do not add downtime again if the machine or labor rate already includes the same idle time.
• Do not add labor and machine cost inside scrap loss if those costs are already included elsewhere in the numerator.
• Document every assumption so another engineer can repeat the calculation.
Cost Components to Measure
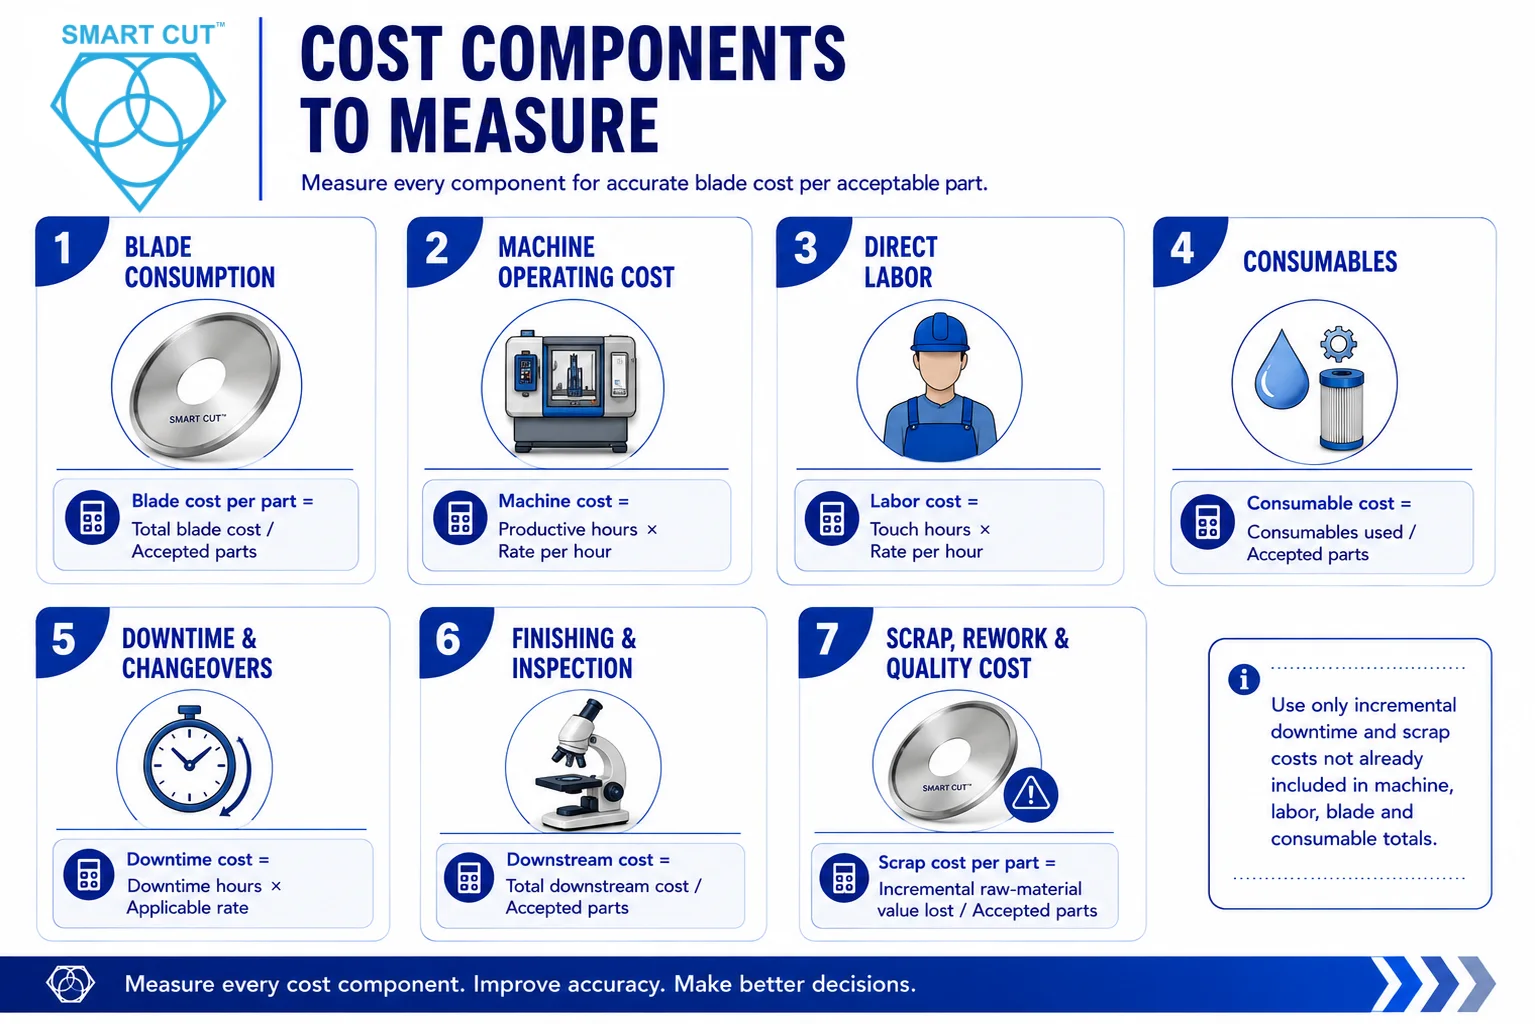
Blade consumption
A lower purchase price does not guarantee a lower blade cost per acceptable part. Blade life, dressing frequency, breakage, loading, loss of dimensional control, and changeover frequency all affect the amount of blade cost consumed during production.
Blade cost per acceptable part = Total blade cost consumed during the batch / accepted parts
Machine operating cost
The machine rate may include depreciation, electricity, preventive maintenance, repair allowance, floor space, and production support. Obtain the approved rate from accounting or calculate it consistently for every test.
Productive machine cost = Productive machine hours x machine operating rate per hour
When cycle time is recorded in minutes, divide the hourly rate by 60 before multiplying by minutes. Include loading and unloading time only if the machine is occupied and unavailable for other work.
Direct labor
Operator touch time can include setup, loading, alignment, blade installation, verification cuts, inspection, cleaning, documentation, and troubleshooting. Automated cycle time should not be charged as direct labor unless the operator remains dedicated to the machine during that period.
Direct labor cost = Operator touch hours x burdened labor rate per hour
Coolant, dressing, filtration, and other consumables
Record coolant concentrate, water treatment, filters, dressing sticks, cleaning supplies, and other consumables that change with the cutting process. These amounts may be small per cut, but they should not appear in the master formula without a defined measurement method.
Consumable cost per acceptable part = Consumables used during the batch / accepted parts
Downtime and changeovers
Blade replacement can require machine shutdown, removal, cleaning, installation, alignment, dressing, parameter confirmation, and verification cuts. Record the actual lost production time and the resources affected.
Attributable downtime cost = Downtime hours x applicable resource rate
Use only the incremental downtime cost that has not already been captured in the machine and labor calculations. Lost contribution margin or lost production capacity may be relevant when the machine is a true constraint, but it should be reported separately from direct manufacturing cost.
Finishing, inspection, and sample preparation
Cut quality can change the amount of grinding, polishing, lapping, microscopy, dimensional inspection, and cleaning required after sectioning. Track technician time, equipment time, consumables, stock removal, and the number of parts requiring extra work.
Downstream cost per acceptable part = Total downstream labor, equipment, and consumables / accepted parts
Scrap, rework, and quality cost
Rejected parts may contain valuable material and prior processing. Rework can consume additional labor, equipment, inspection, and consumables. External failures can add returns, replacement, complaint handling, and warranty cost.
The American Society for Quality groups quality costs into prevention, appraisal, internal failure, and external failure categories. This structure is useful when defining which inspection, scrap, rework, and customer-related costs belong in the model.
To avoid double counting, many blade-comparison models include only the incremental raw-material value lost to rejected parts in the scrap row. Machine, labor, blade, and consumable costs for all attempted parts are already included in the batch totals and are spread across accepted output.
Worked Comparison: Blade A Versus Blade B
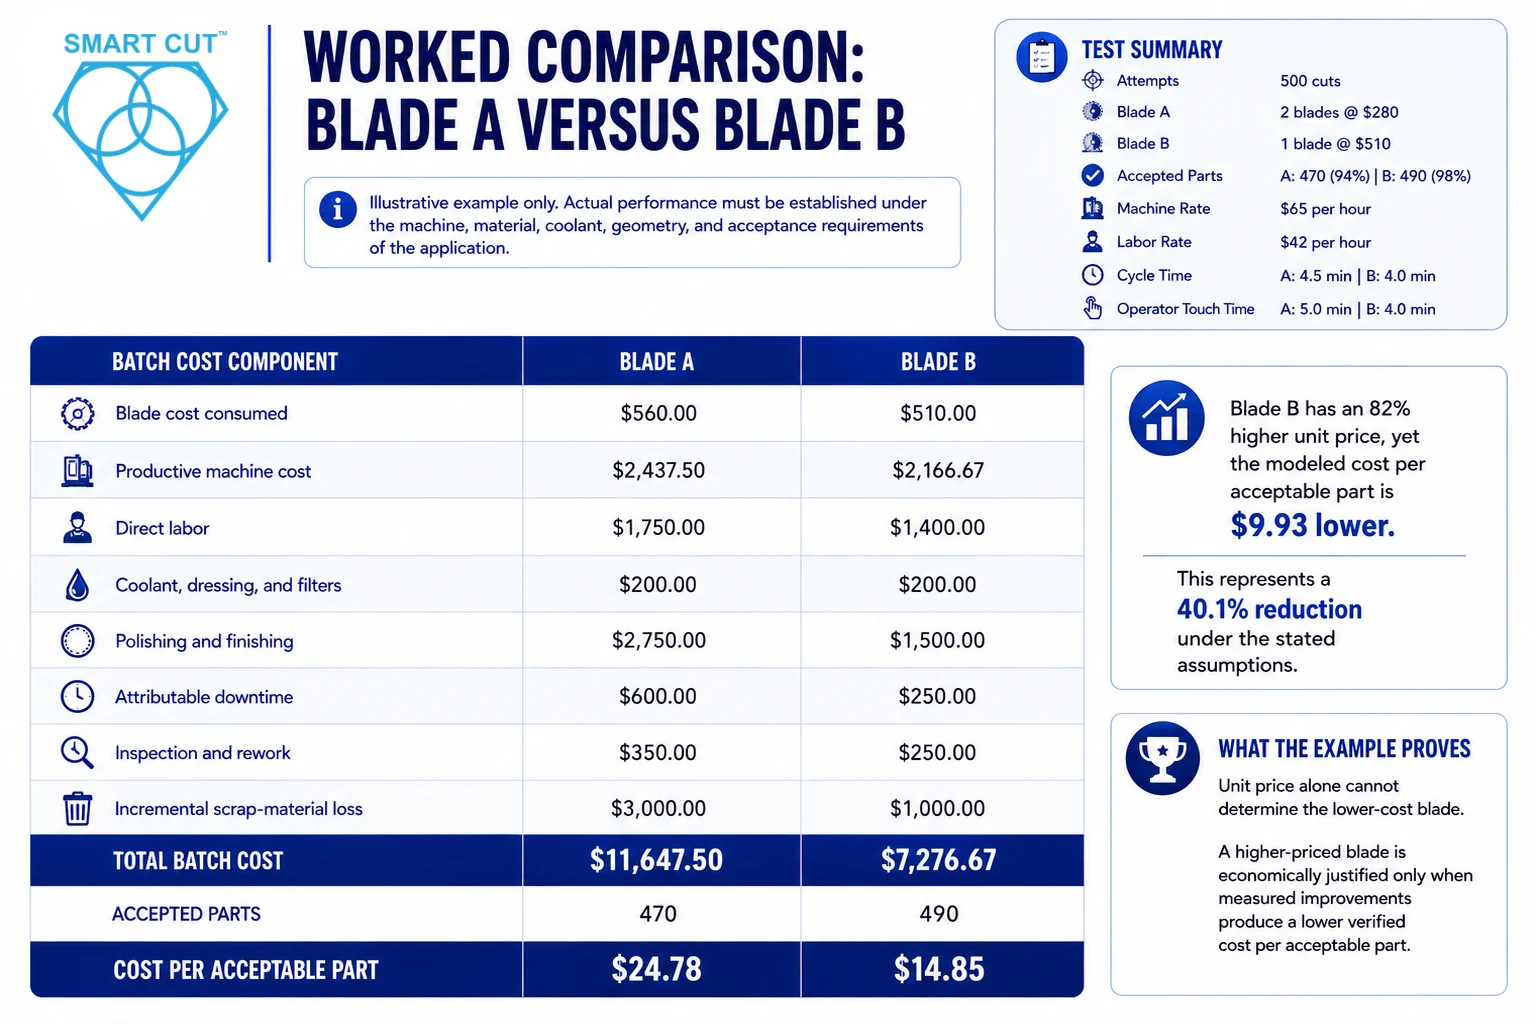
The following example is illustrative. It is not a claim about a specific UKAM product, customer, material, or field test. Actual performance must be established under the machine, material, coolant, geometry, and acceptance requirements of the application.
Both blades are evaluated over 500 attempted cuts. Blade A costs $280 per blade and two blades are consumed. Blade B costs $510 and one blade is consumed. Blade A produces 470 acceptable parts for a 94 percent first-pass yield. Blade B produces 490 acceptable parts for a 98 percent first-pass yield.
The machine rate is $65 per hour. Average productive cycle time is 4.5 minutes for Blade A and 4.0 minutes for Blade B. The burdened labor rate is $42 per hour. Average operator touch time is 5.0 minutes for Blade A and 4.0 minutes for Blade B. The scrap-material row contains only the lost raw-material value. Conversion costs for rejected attempts are already included in the batch costs.
| Batch cost component | Blade A | Blade B |
|---|---|---|
| Blade cost consumed | $560.00 | $510.00 |
| Productive machine cost | $2,437.50 | $2,166.67 |
| Direct labor | $1,750.00 | $1,400.00 |
| Coolant, dressing, and filters | $200.00 | $200.00 |
| Polishing and finishing | $2,750.00 | $1,500.00 |
| Attributable downtime | $600.00 | $250.00 |
| Inspection and rework | $350.00 | $250.00 |
| Incremental scrap-material loss | $3,000.00 | $1,000.00 |
| Total batch cost | $11,647.50 | $7,276.67 |
| Accepted parts | 470 | 490 |
| Cost per acceptable part | $24.78 | $14.85 |
Blade B has an 82 percent higher unit price, yet the modeled cost per acceptable part is $9.93 lower. This represents a 40.1 percent reduction under the stated assumptions. The result comes from the complete production effect, including blade consumption, cycle time, labor, yield, finishing, downtime, and scrap-material loss.
What the example proves: Unit price alone cannot determine the lower-cost blade. A higher-priced blade is economically justified only when measured improvements produce a lower verified cost per acceptable part.
Where the Dominant Cost Changes by Application
The same model can be used across industries, but the largest cost driver changes with the material, part geometry, process stage, and acceptance requirement.
| Application | Common cost drivers | Measurements to emphasize |
|---|---|---|
| Semiconductor and failure analysis | Sample value, edge damage, subsurface damage, polishing time, repeat preparation | Accepted sections, preparation time, edge integrity, inspection repeatability |
| Optical glass, quartz, and sapphire | Chipping, kerf loss, cracking, surface damage, polishing stock | Parts per workpiece, kerf, chip size, polishing time, reject rate |
| Advanced ceramics | Edge chipping, blade wear, cycle time, dimensional variation | First-pass yield, cuts per blade, cycle time, dimensional capability |
| Carbide, PCD, and CBN components | Material recovery, grinding allowance, blade loading, machine time | Material utilization, stock removal, blade consumption, throughput |
| Aerospace and engineered composites | Delamination, fiber pullout, heat damage, finishing, scrap | Defect rate, finishing time, accepted parts per shift, dimensional stability |
These are evaluation priorities, not universal performance claims. Each blade and process combination must be validated under representative operating conditions.
How to Run a Fair Blade Comparison
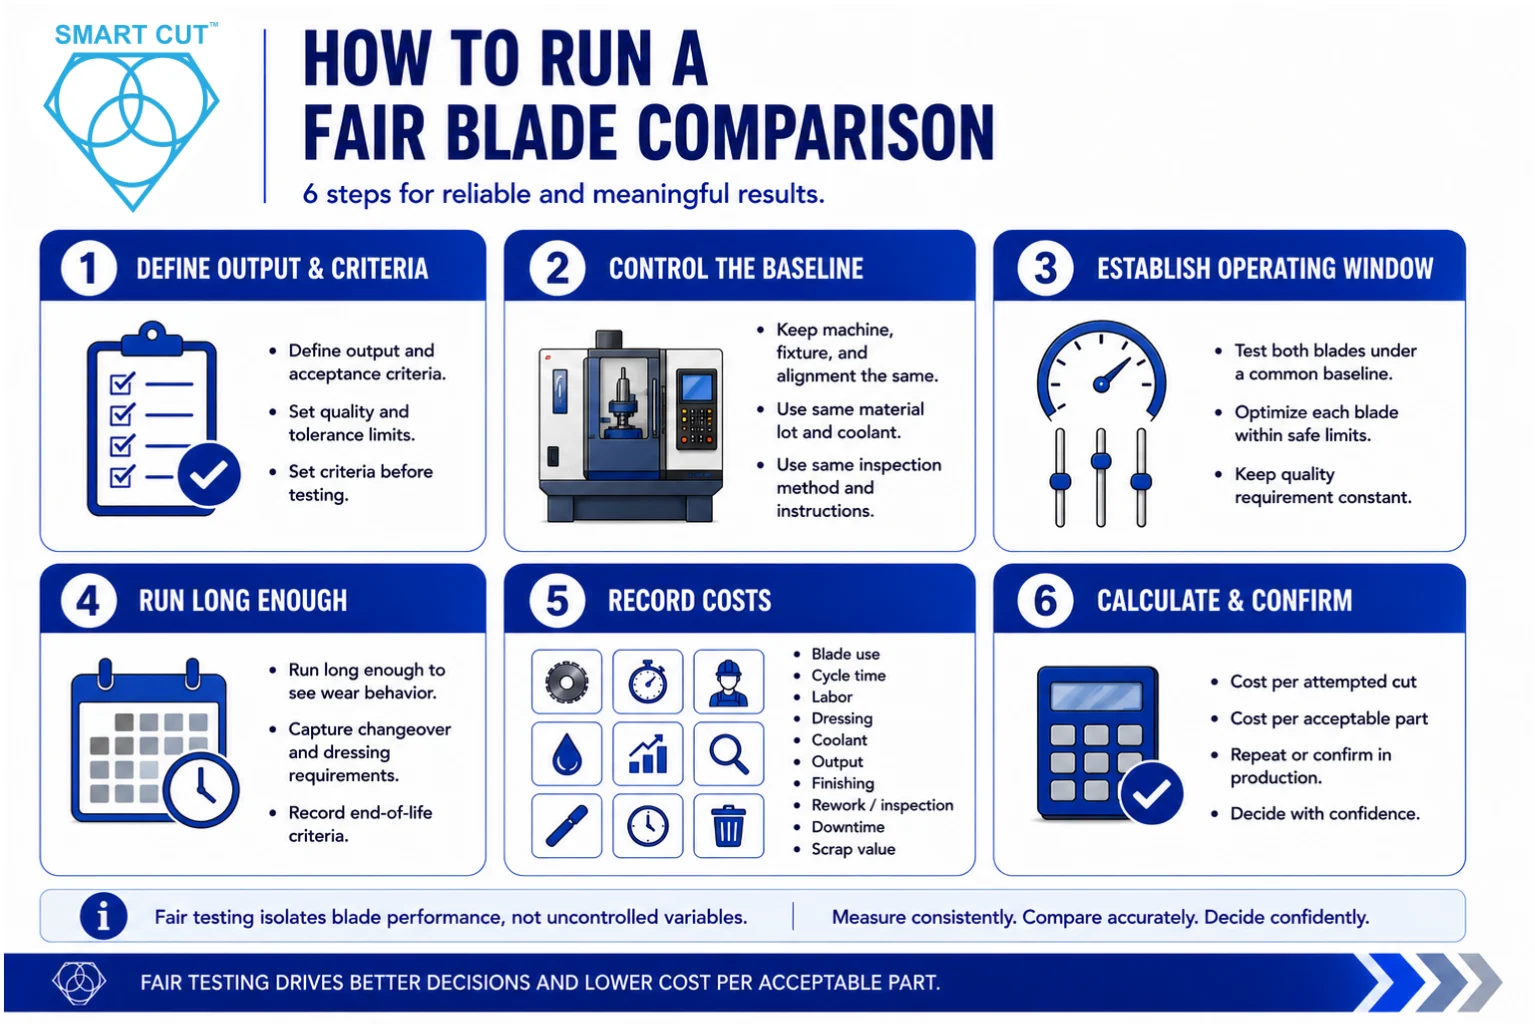
1. Define the output and acceptance criteria. State whether the denominator is attempted cuts, accepted cuts, or good parts. Define dimensional tolerance, edge chipping, surface condition, cracking, delamination, and any downstream preparation requirements before testing begins.
2. Control the baseline. Use the same machine condition, spindle and arbor, flange condition, alignment method, fixture, material lot, workpiece geometry, coolant concentration, coolant delivery, inspection method, and operator instructions.
3. Establish a stable operating window. An identical speed and feed may not be fair when two blade specifications require different operating conditions. Screen both under a common baseline, then optimize each blade within safe machine and blade limits while holding the quality requirement constant.
4. Run long enough to capture wear behavior. A short demonstration can miss loading, loss of sharpness, dressing requirements, runout sensitivity, and changeover frequency. Use a test duration that represents stable production and records the end-of-life criterion.
5. Record every affected cost. Track blade consumption, productive cycle time, operator touch time, dressing, coolant and filtration, accepted output, kerf or parts per workpiece, polishing, rework, inspection, downtime, and scrap-material value.
6. Calculate and confirm. Calculate cost per attempted cut and cost per acceptable part. Repeat the comparison or confirm the result in a production release before making a high-volume purchasing decision.
Manufacturing KPIs to Track
| KPI | What it shows |
|---|---|
| First-pass yield | Accepted parts without rework divided by total attempted parts. |
| Cost per acceptable part | The combined economic result of blade and process performance. |
| Good parts per blade | Usable output produced before the blade reaches its defined end of life. |
| Average productive cycle time | Machine time required for one attempted cut under stable conditions. |
| Operator touch time | Direct labor required for setup, loading, adjustment, inspection, and cleaning. |
| Blade-change frequency | How often production stops for replacement, alignment, and verification. |
| Polishing or finishing time | Downstream work created by sectioning quality. |
| Material utilization | Usable output recovered from the starting material, including kerf effects. |
| Process variation | Consistency of dimensions, edge quality, cycle time, and blade wear. |
Practical Ways to Reduce Cost per Acceptable Part
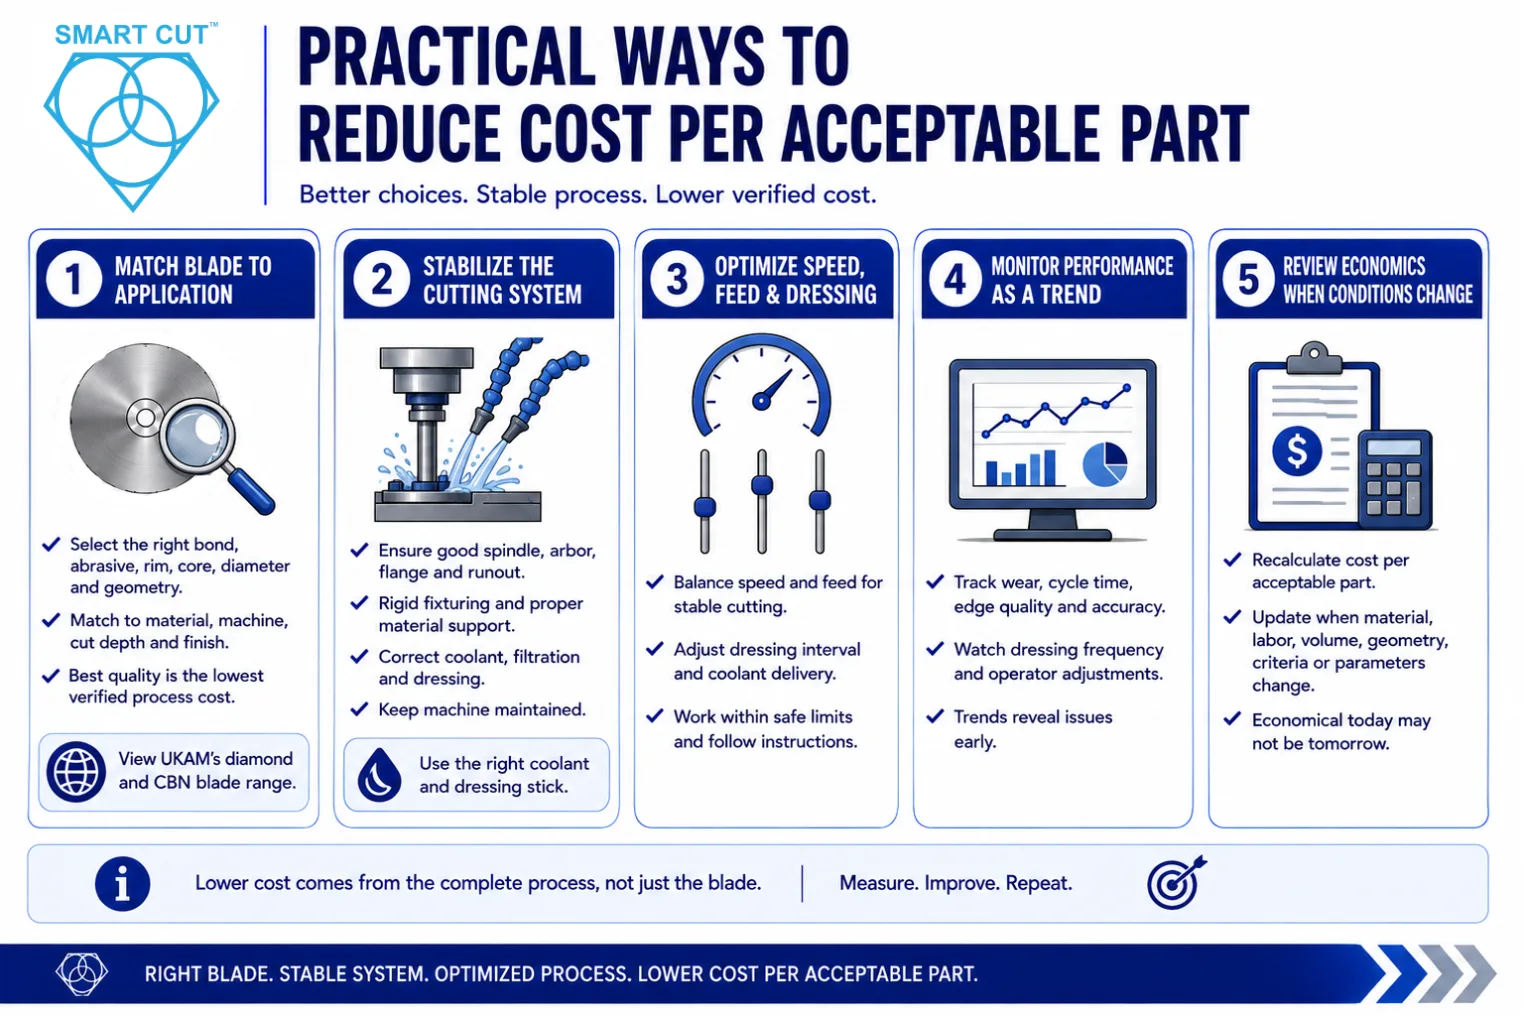
Match the blade specification to the application
Select bond type, abrasive size, concentration, rim thickness, core design, diameter, and geometry according to the material, machine, cut depth, required finish, and production objective. There is no single highest-quality blade for every operation. The correct choice is the specification that meets the required quality at the lowest verified process cost.
Review UKAM’s precision diamond and CBN blade range and match the blade to the machine and material before running a production comparison.
Stabilize the cutting system
Blade performance depends on the complete system. Check spindle and arbor condition, flange cleanliness, runout, fixture rigidity, material support, coolant direction and flow, filtration, dressing method, and machine maintenance. An unstable setup can make a suitable blade appear uneconomical.
Use the appropriate diamond-tool coolant and a compatible dressing stick when the blade and process require them.
Optimize speed, feed, and dressing
Excessive feed can increase deflection, chipping, heat, and wear. An unnecessarily low feed can reduce throughput and increase machine cost. Spindle speed, feed, dressing interval, and coolant delivery should be adjusted within safe limits to produce a stable cut and the required quality. Follow the machine and blade instructions and never exceed their rated operating limits.
Monitor performance as a trend
Track blade wear, cycle time, edge quality, dimensional accuracy, dressing frequency, and operator adjustment over the blade’s service life. Averages alone can hide gradual deterioration or unstable results near end of life.
Review the economics when conditions change
Recalculate cost per acceptable part when material price, labor rate, machine utilization, production volume, workpiece geometry, acceptance criteria, or cutting parameters change. A blade that is economical for one application may not remain economical after the process changes.
Frequently Asked Questions
Cost per acceptable part assigns the cost of all production attempts to usable output. It reflects yield, scrap, rework, downtime, and downstream work that a simple blade-price comparison misses.
Yes, but only when measured improvements offset the higher purchase price. Possible improvements include more acceptable parts per blade, shorter cycle time, less polishing, fewer blade changes, lower scrap, and better material utilization.
Define end of life before the test. Examples include maximum wear, unacceptable chipping, dimensional drift, increased cutting time, loss of surface quality, excessive dressing, or a safety limit. Report good parts per blade as well as total attempted cuts.
Kerf removes material. In high-value slicing, a smaller stable kerf can increase the number of parts recovered from one workpiece. Kerf should be evaluated together with blade stability, chipping, dimensional control, cut straightness, and polishing allowance.
Update the model whenever a major cost or process condition changes. Review it periodically in continuing production because material value, labor, machine rates, volumes, and blade performance can change over time.
The economic value of a precision diamond blade cannot be determined from purchase price alone. The blade affects productive machine time, labor, consumables, material utilization, first-pass yield, finishing, downtime, and quality. These effects must be measured over the same production batch and divided by the same accepted output.
A consistent cost-per-acceptable-part model allows purchasing, engineering, production, and quality teams to compare blade alternatives using the same evidence. It also identifies where process improvements will produce the largest savings.
UKAM Industrial Superhard Tools manufactures precision diamond and CBN blades and precision cutting equipment for industrial, laboratory, research, and advanced-material applications. For an application review, provide the material, workpiece dimensions, cut depth, machine, spindle speed, feed rate, coolant, current blade, present blade life, required edge quality, and acceptable tolerances.
You can review UKAM’s precision cutting machines or request an applications engineering consultation for help defining a controlled blade evaluation.
Technical reference: American Society for Quality, Cost of Quality. The framework distinguishes prevention, appraisal, internal failure, and external failure costs.
Trusted by Tens of Thousands of Manufacturers, Laboratories,
Research Institutions Worldwide Since 1990
American Based Manufacturer
Established in 1990
Custom manufacturing
RELATED ARTICLES