


















Diamond Blade Testing Procedure: Measure Blade Life, Cut Rate, and Quality

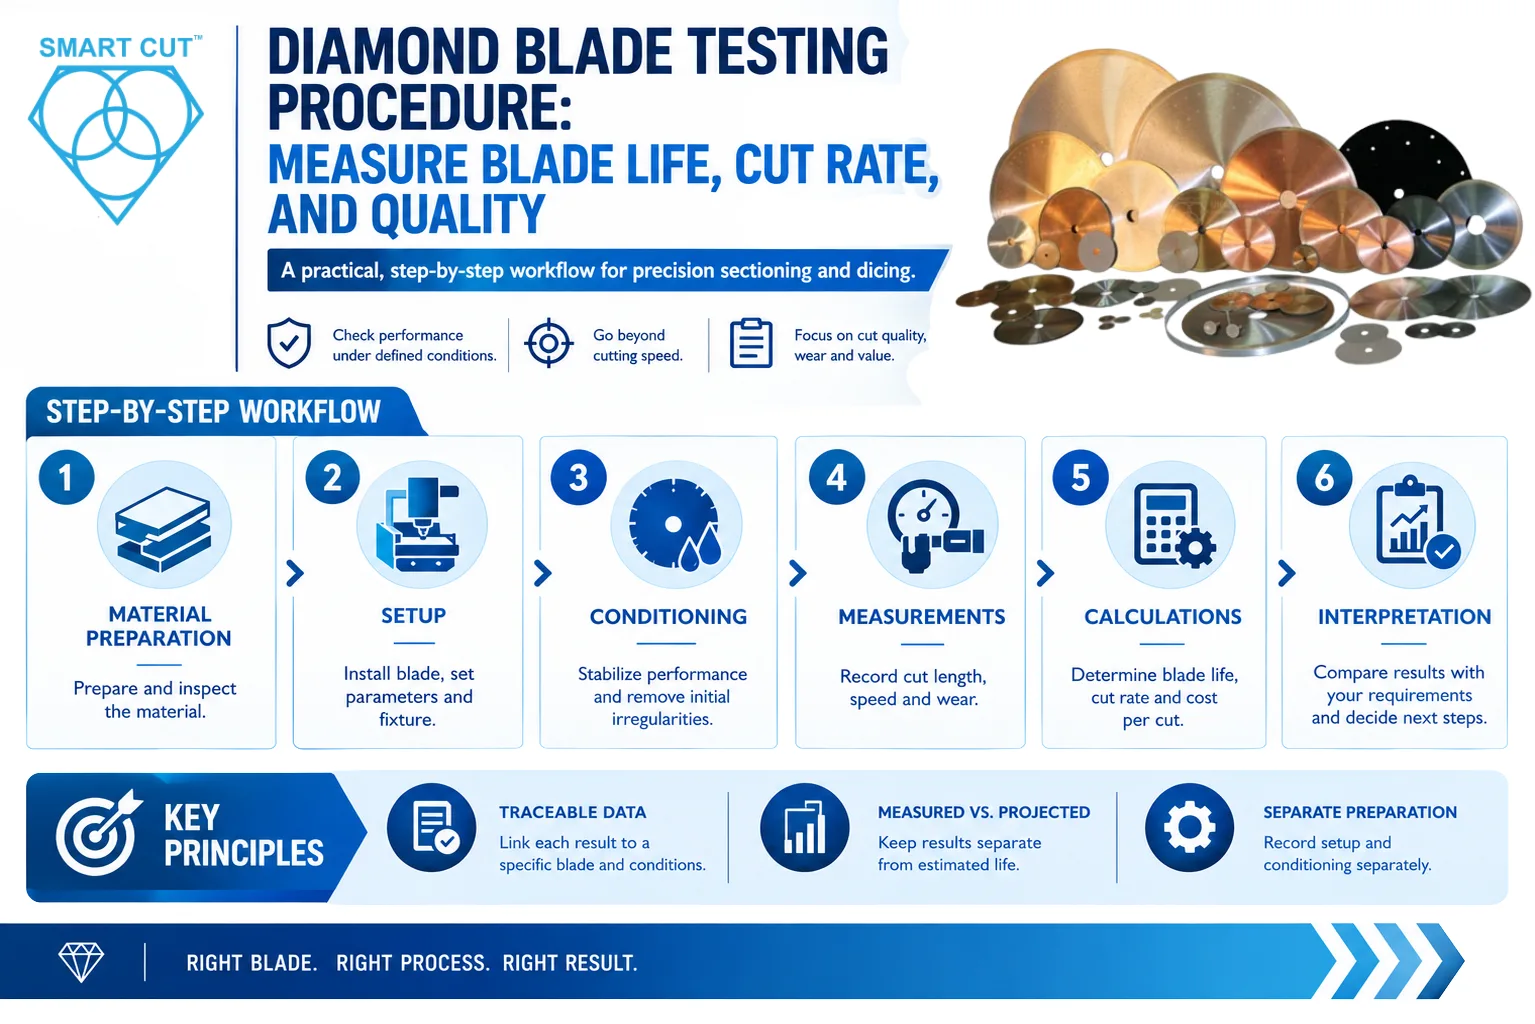
Table of Contents
ToggleA useful diamond blade test shows how the blade performs under defined conditions and whether that performance meets your application requirements. Cutting speed alone is not enough. A blade must also maintain acceptable cut quality, wear predictably, and produce an economical number of usable cuts.
This diamond blade testing procedure follows the working sequence at the machine. It covers material preparation, setup, conditioning, measurements, calculations, and interpretation. You can use it to evaluate one blade or compare several configurations. Adapt the measurement method and operating limits to the blade construction, machine, and material.
The central requirement is traceable data. Each reported result must correspond to a known blade, a defined amount of cutting, and documented operating conditions. Distinguish measured results from projected life, and record preparation separately from the production test.
Trusted by Tens of Thousands of Manufacturers, Laboratories Research Institutions Worldwide Since 1990

American Based Manufacturer

Established in 1990


Custom manufacturing


Before You Begin: Prepare the Test Record and Equipment

Have the applicable blade and machine instructions, matched material samples, suitable workholding, a timing method, and measurement equipment appropriate to the expected tolerances. Prepare a setup record and a cutting log before mounting the blade. Confirm instrument identification, calibration status, and measurement capability.
Use this short preparation check:
- Define the test objective, quality limits, inspection intervals, and stopping criteria.
- Document the blade, machine, material, workholding, and permitted operating settings.
- Select the conditioning method and the rule for any dressing during the test.
- Prepare suitable instruments and a consistent method for measuring wear and cut quality.
Use the machine safely throughout the procedure. Follow its instructions for isolation, mounting, guarding, and protective equipment. Never take contact measurements on a powered or moving blade. Keep all trial settings within the permitted limits for the complete setup.
Step 1: Define the Objective and Acceptance Limits
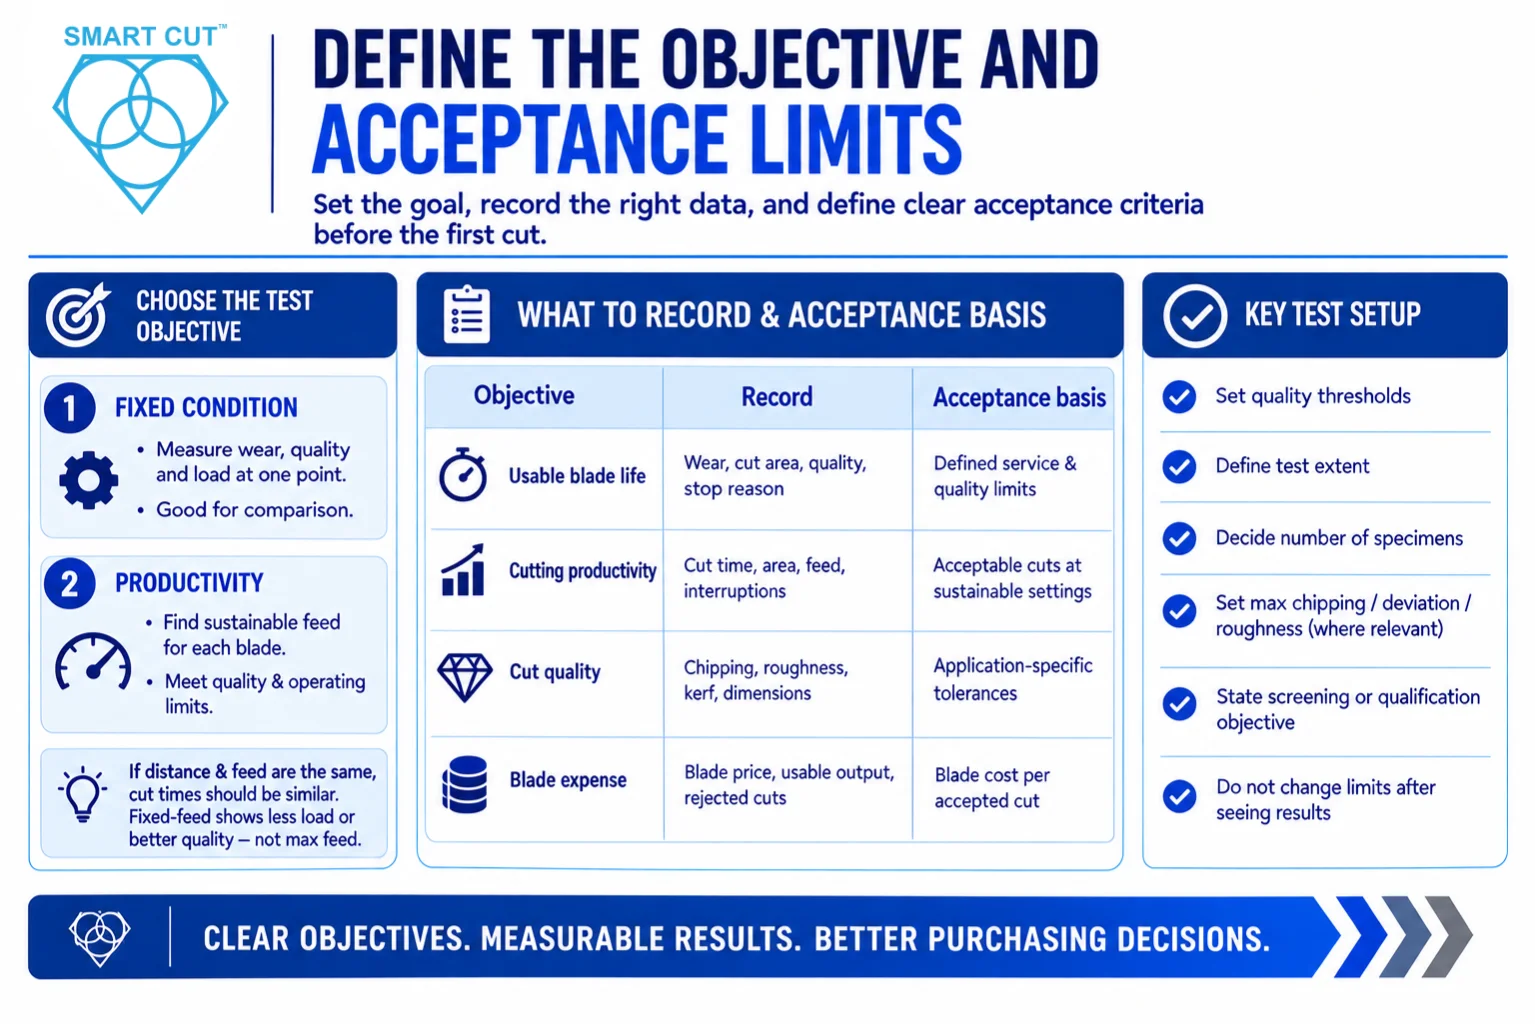
Decide what the test must establish before making the first cut. A fixed-condition comparison measures wear, quality, and load at a common operating point. A productivity evaluation determines the sustainable feed each blade can achieve while meeting the same quality and operating limits. Identify which approach you are using.
If cutting distance and actual feed are identical, cutting times should be approximately equal. A fixed-feed test can show that one blade cuts with less load or better edge quality. It does not establish that blade’s maximum productive feed rate.
| Objective | Record | Acceptance basis |
|---|---|---|
| Usable blade life | Wear, cumulative cut area, quality, stop reason | Defined service and quality limits |
| Cutting productivity | Actual cutting time, cut area, feed, interruptions | Acceptable cuts at sustainable settings |
| Cut quality | Chipping, roughness, kerf, dimensional results | Application-specific tolerances |
| Blade expense | Blade price, usable output, rejected cuts | Blade cost per accepted cut |
Set quality thresholds, the planned test extent, and the number of blade specimens before testing. Define maximum permitted chipping, dimensional deviation, or roughness where relevant. State whether the objective is preliminary screening or qualification for production. Avoid selecting acceptance limits after seeing which blade performs better.
Step 2: Prepare and Document the Test Material
Use material representative of the actual application. Prepare matched dimensions and obtain samples from the same lot where practical. Differences in hardness, structure, porosity, coatings, or thickness can appear in the results as blade differences.
Record the material grade, lot, dimensions, and relevant properties. Include crystal or fiber orientation when cutting direction affects the application. For coated, composite, or multilayer specimens, document the layer arrangement and cutting direction. Use the same mounting medium, backing support, and preparation method for comparable samples.
Identify each specimen before cutting. Keep its condition consistent, including temperature and moisture where these matter. Allocate samples across the blades so one configuration does not receive all of one material region or preparation batch. Record unavoidable differences rather than assuming they have no effect.
Step 3: Inspect the Machine and Workholding
Check the spindle, bearings, feed mechanism, flanges, and fixture before the blade trial. Clean the mounting surfaces and inspect for damage, burrs, or contamination. Verify spindle and flange runout using suitable equipment and the machine’s specified procedure.
Confirm that the fixture supports the specimen throughout entry, full engagement, and exit. Prevent specimen movement and uncontrolled movement of the offcut. Excessive clamping force can distort a thin or brittle sample, while inadequate support can increase chipping and cut deviation.
Verify actual RPM and feed where practical. Record the verification method and whether feed is controlled by speed, force, or another machine function. Check coolant delivery and establish a consistent machine warm-up condition. Correct setup problems before collecting comparison data.
Step 4: Record the Blade’s Incoming Condition
Assign a unique blade identifier. Record outside diameter, nominal thickness, arbor size, bond, grit, and other known specification details. Include abrasive depth or exposure where relevant. Inspect the blade for damage and document its condition before installation.
Measure the incoming diameter using equipment suitable for the blade size, edge geometry, and expected wear. A caliper can suit larger measurable changes. Small wear differences may require a more capable measurement system. Resolution alone does not establish accuracy or measurement uncertainty.
Use defined measurement orientations and repeat readings as needed to establish repeatability. Retain individual values and their spread, as well as the average. Control contact force and avoid deflecting thin blades. Keep the blade clean and use a consistent temperature condition.
This incoming measurement documents the new blade. After conditioning, take a second baseline for the measured cutting test. Keeping both values separates preparation wear from subsequent test wear.
Step 5: Install the Blade and Verify the Assembly
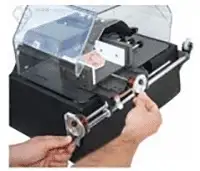
Mount the blade with the correct arbor fit, compatible flanges, and specified tightening method. Check direction where the blade is directional. Select flange support and blade exposure appropriate to the cutting depth and blade construction.
Follow the machine’s procedure for checking the installed assembly. A brief guarded no-load run can reveal abnormal noise or vibration, but visual observation does not replace a suitable runout measurement. Stop and resolve abnormal behavior before cutting.
Record flange dimensions, exposed blade depth, and the workholding arrangement. If the blade is removed for later wear measurements, restore the documented mounting arrangement and repeat the required checks before resuming. Remounting can introduce variation that must be controlled.
For additional mounting guidance, see how to properly use precision diamond blades.
Step 6: Set and Verify the Cutting Conditions
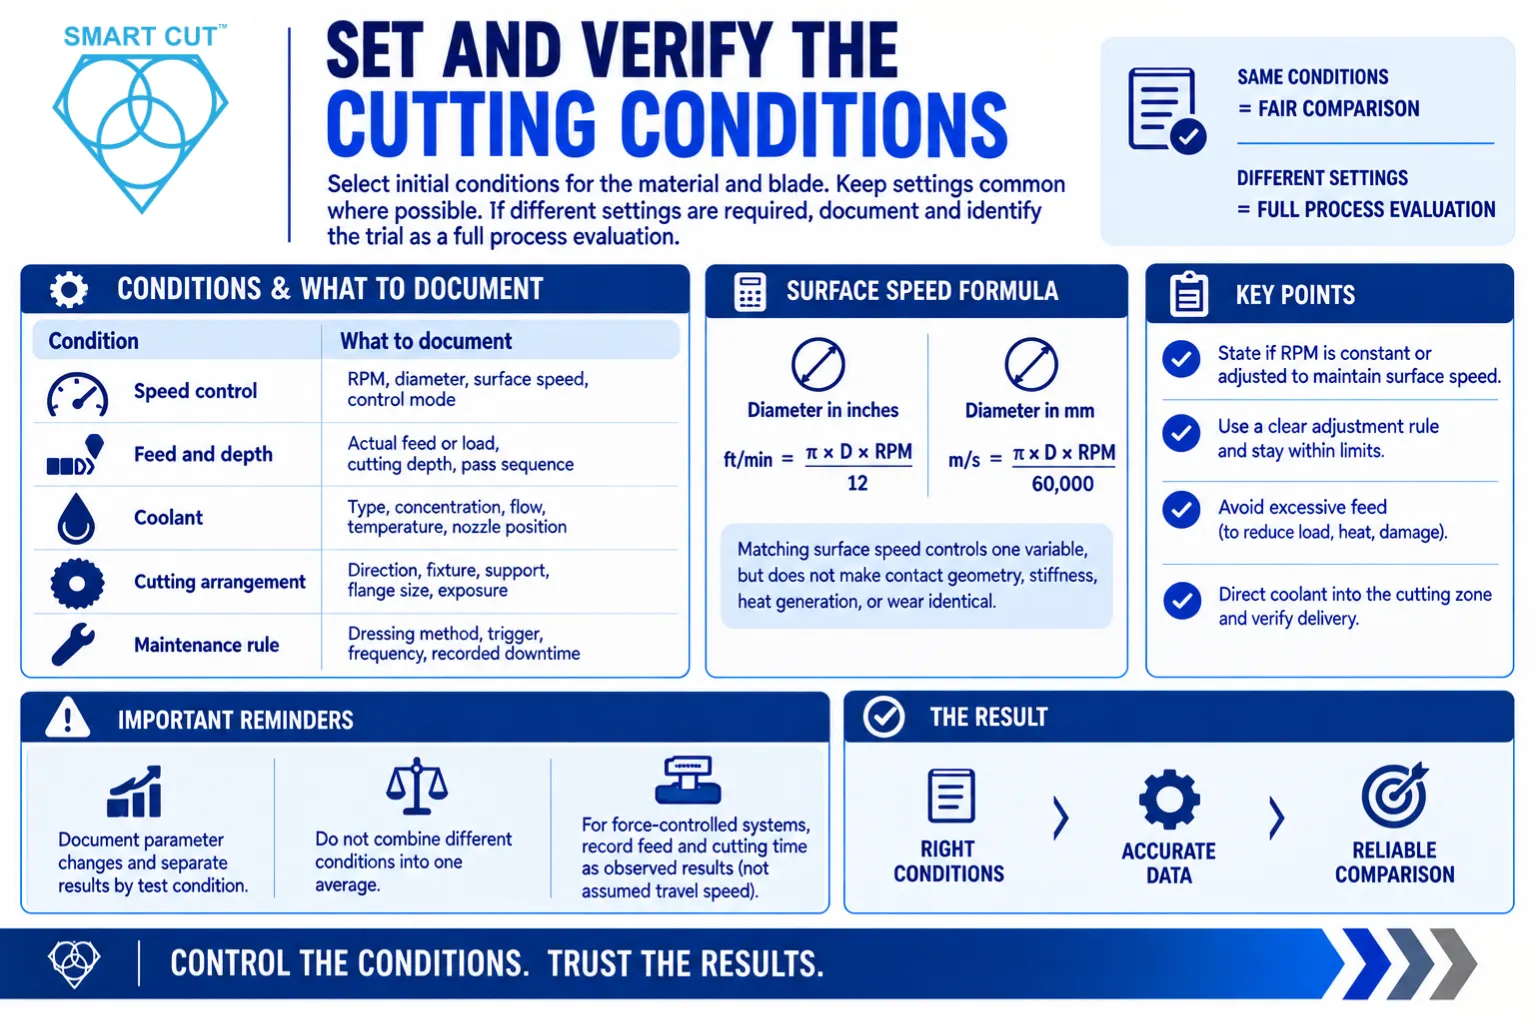
Select initial conditions appropriate to the material and blade. For a comparison at common settings, use conditions permitted for every configuration. If blades require different preparation or operating settings, document those differences and identify the trial as an evaluation of each complete cutting process.
| Condition | What to document |
|---|---|
| Speed control | RPM, diameter, calculated surface speed, control mode |
| Feed and depth | Actual feed or applied load, cutting depth, pass sequence |
| Coolant | Type, concentration, flow, temperature, nozzle position |
| Cutting arrangement | Direction, fixture, support, flange size, exposure |
| Maintenance rule | Dressing method, trigger, frequency, recorded downtime |
Surface speed depends on diameter and RPM. With diameter in inches, surface speed in feet per minute equals π × diameter × RPM ÷ 12. With diameter in millimeters, speed in meters per second equals π × diameter × RPM ÷ 60,000.
Matching surface speed controls one variable when diameters differ. It does not make contact geometry, stiffness, heat generation, or wear identical. State whether the test holds RPM constant or adjusts RPM to maintain surface speed as the blade wears. Apply a predefined adjustment rule and stay within permitted limits.
Excessive feed can increase load, deflection, heat, and damage. Glazing involves loss of effective cutting sharpness and depends on the bond, material, and operating conditions. Avoid treating it as proof of one specific feed error. Direct appropriate coolant into the cutting zone and verify effective delivery.
Document parameter changes and divide the results into the corresponding test conditions. Do not combine different conditions into one unexplained average. For force-controlled equipment, record feed and cutting time as observed results rather than assuming constant travel speed.
Step 7: Condition the Blade and Establish the Test Baseline
Follow a conditioning method appropriate to the blade construction and application. This may involve controlled trial cuts or an approved dressing material. Do not apply one dressing method automatically to metal, resin, vitrified, and electroplated blades.
Single-layer electroplated tools require particular care because aggressive dressing can remove the working abrasive layer. Use only a suitable, approved method for that construction. Even where conditioning is brief, document what was done.
Define steady cutting in advance using the relevant observations, such as stable load and consistent cut quality over a planned observation window. At fixed actual feed, similar cutting times alone are not sufficient evidence of stable blade performance.
Record conditioning time, cuts, material consumption, and dressing. Then measure the blade again. Use this post-conditioning diameter as the starting point for the measured test. Begin the cutting-area and time counters for that test at the same point. Keep conditioning costs available for the complete production assessment.
Step 8: Make the Cuts and Record Results as You Go
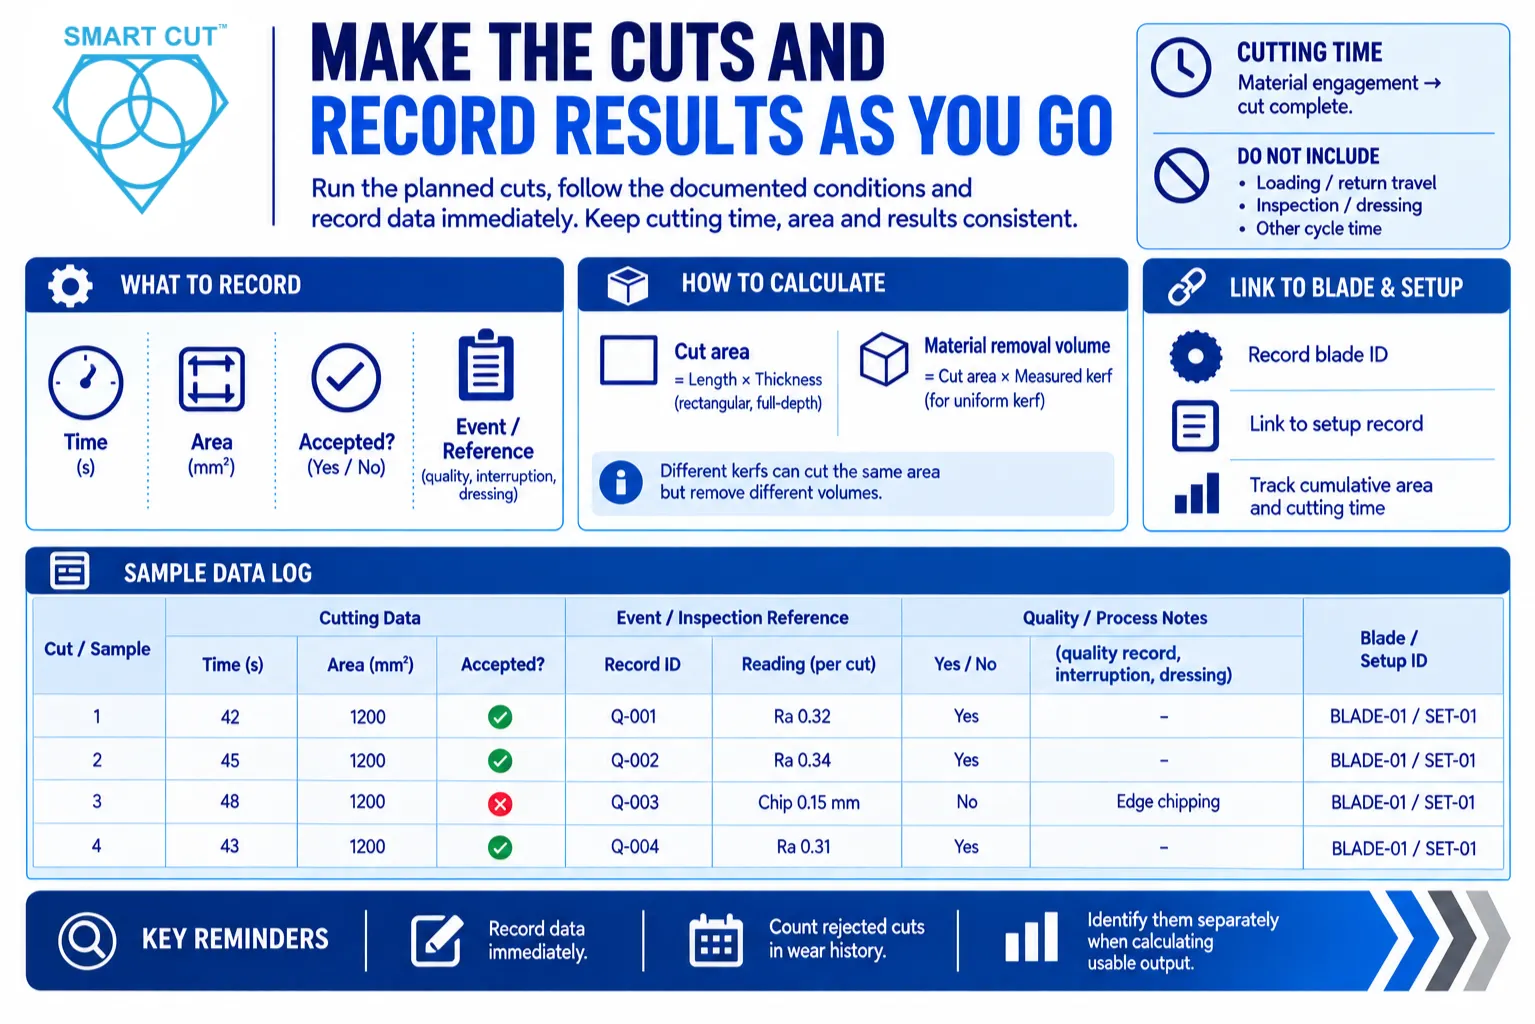
Run the planned cuts under the documented conditions. Record data immediately. Define cutting time consistently, such as the period from material engagement to completion of the cut. Keep it separate from loading, return travel, inspection, dressing, and other cycle time.
Define the quantity being cut. For a straight, full-depth cut through a rectangular section, cut area equals cutting length multiplied by material thickness. Count one cut plane. Do not double the area because the operation creates two faces. For other geometries, calculate the actual section area or use a clearly defined alternative.
Material removal volume is different. For a uniform kerf, approximate removal volume equals cut area multiplied by measured kerf width. Blades with different kerfs can cut the same area while removing different volumes.
| Cut / sample | Time, s | Area, mm² | Accepted? | Event or inspection reference |
|---|---|---|---|---|
| Record ID | Reading | Per cut | Yes / no | Quality record, interruption, dressing |
| Record ID | Reading | Per cut | Yes / no | Quality record, interruption, dressing |
Link each row to the blade identifier and setup record. Track cumulative area and cutting time. Record load where available, along with pauses, unusual sound, vibration, and coolant problems. Count rejected cuts in the wear history because they still consume blade life. Identify them separately when calculating usable output.
Step 9: Measure Wear at Planned Intervals
Choose inspection intervals that allow meaningful wear measurement without missing a developing problem. Depending on the application, intervals may be based on accumulated cut area, cut count, or cutting time. Apply the planned schedule consistently and add an inspection when abnormal behavior requires it.
Stop the machine and follow its safe measurement procedure. Clean the blade as appropriate, allow a consistent measurement condition, and repeat the baseline method. Record the actual diameter at each interval, cumulative diameter reduction, and wear since the preceding interval.
Diameter reduction equals starting diameter minus current diameter. Radial wear is half that value. For example, a 0.040-inch diameter reduction represents 0.020 inch of radial wear. Never mix diameter loss and radial abrasive depth in one calculation.
Compare each interval’s wear with the amount cut during that interval. A trend toward faster wear deserves investigation. Record dressing losses separately when practical. For an operational life estimate, account for the wear and downtime caused by the dressing policy the process requires.
If measured wear cannot be distinguished reliably from measurement uncertainty, extend the observation period where safe or improve the measurement method. Report insufficient measurable wear for projection. A zero displayed change does not establish zero wear or unlimited life.
Step 10: Measure Cut Quality Against the Agreed Limits
Inspect at the planned intervals and whenever behavior changes. Keep specimen preparation, measurement locations, instrument settings, and reporting units consistent. Clean the surface without polishing away the evidence of cutting damage.
| Quality metric | Repeatable assessment |
|---|---|
| Edge chipping | Defined chip dimension, inspection length, entry/exit locations, calibrated imaging |
| Surface roughness | Selected parameter such as Ra, suitable profilometer, consistent trace settings |
| Kerf width | Measured cut width at defined locations using suitable dimensional or optical equipment |
| Straightness / dimensions | Deviation from the specified reference, measured over a defined distance |
| Application-specific damage | Defined inspection for cracks, delamination, or other relevant defects |
For edge quality, report maximum chipping as well as a representative summary where useful. A favorable average can conceal a defect that exceeds the acceptance limit. For roughness, keep evaluation length and measurement direction consistent.
Nominal blade thickness is not a substitute for measured kerf. Likewise, a clean-looking surface does not establish absence of subsurface damage. Use an appropriate additional assessment when the application requires it. Mark each inspected specimen as accepted or rejected and retain the supporting measurements or images.
For more detailed inspection methods, see how to measure diamond blade cut quality.
Step 11: Calculate Wear, Productivity, and Blade Expense
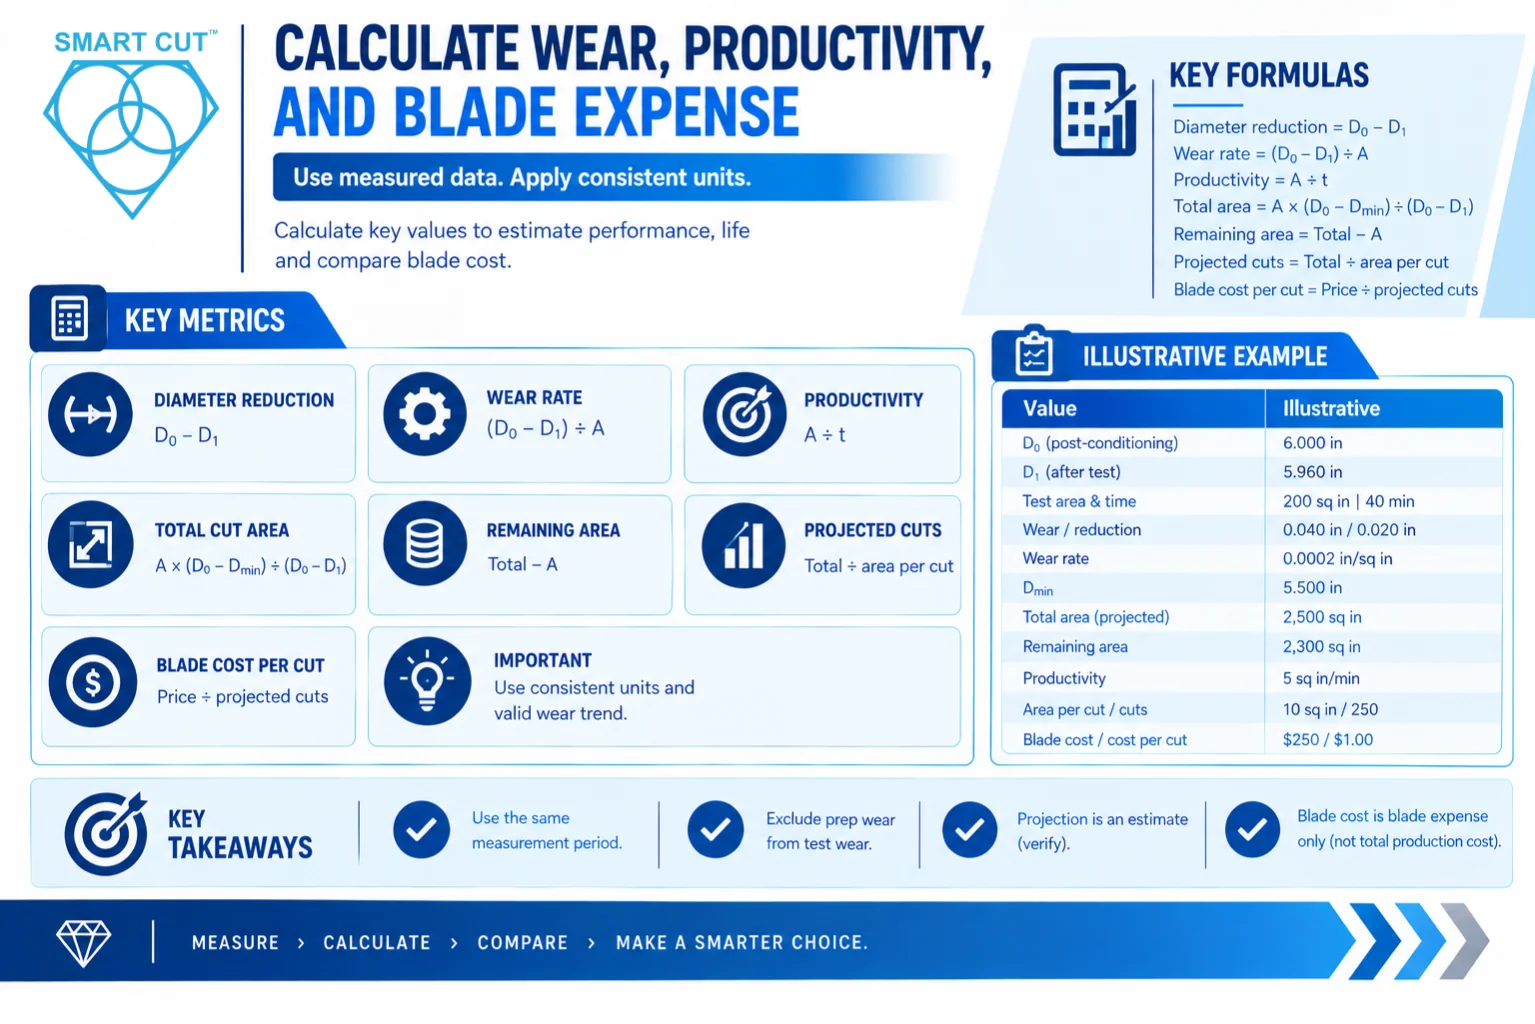
Use measurements from the same defined test period. Let D0 be the post-conditioning diameter, D1 the diameter after measured cutting, Dmin the minimum permitted service diameter, A the accumulated cut area, and t the actual cutting time. Use consistent units.
Diameter reduction = D0 − D1
Diameter wear rate = (D0 − D1) ÷ A
Cutting productivity = A ÷ t
Projected total cut area from the conditioned start = A × (D0 − Dmin) ÷ (D0 − D1)
Projected remaining cut area = projected total cut area − A
Projected cuts = projected total cut area ÷ area per cut
Projected blade cost per cut = blade price ÷ projected cuts
The life formula assumes approximately constant diameter wear per unit area and a valid diameter-based stopping limit. Use it only when the observed wear trend and blade construction support that assumption. Earlier quality failure, damage, loss of cutting ability, or a changing wear rate can invalidate the projection.
| Quantity | Illustrative value or calculation |
|---|---|
| Incoming diameter | 6.010 in |
| Post-conditioning diameter, D0 | 6.000 in |
| Diameter after measured test, D1 | 5.960 in |
| Test area and cutting time | 200 sq in in 40 minutes |
| Diameter reduction / radial wear | 0.040 in / 0.020 in |
| Diameter wear rate | 0.040 ÷ 200 = 0.0002 in per sq in |
| Minimum permitted diameter, Dmin | 5.500 in, assumed for this example only |
| Projected total cut area | 200 × (0.500 ÷ 0.040) = 2,500 sq in |
| Projected remaining cut area | 2,500 − 200 = 2,300 sq in |
| Measured cutting productivity | 200 ÷ 40 = 5 sq in per minute |
| Area per cut / projected total cuts | 10 sq in / 250 cuts |
| Blade price / blade expense | $250 / $1.00 per cut or $0.10 per sq in |
The incoming-to-conditioned diameter change is 0.010 inch. That preparation wear is excluded from the measured test wear rate, while the remaining abrasive allowance starts at the conditioned diameter. The projected 250 cuts include the 20 measured test cuts. The estimated remaining capacity is 230 cuts.
This calculation projects total capacity to 12.5 times the tested area. Treat that extension as an estimate requiring confirmation. The $1.00 figure covers blade expense only and assumes every projected cut is acceptable. If rejects occur, blade expense per accepted cut is higher.
For total process cost, include machine and labor time, conditioning, dressing, consumables, rejected material, and relevant downstream finishing. Divide the applicable costs by accepted output over the same defined accounting period. Report cutting productivity and complete cycle productivity separately.
Step 12: Confirm Service Life and Report the Decision
Review interval wear and quality together. Determine whether the data support a provisional projection, require additional testing, or already show that the blade fails an application requirement. Do not rank blades by projected life alone.
Establish minimum service diameter from the blade’s usable abrasive section, permitted exposure, flange clearance, required cutting depth, and operating instructions. Stop earlier if the predefined quality or operating limit is reached. A service-life trial ends at that limit. It does not require blade breakage.
Diameter-based projection may be unsuitable when abrasive dulling, profile loss, or quality deterioration controls service life. This is especially relevant to some single-layer tools and precision applications. In those cases, track acceptable output to the applicable service endpoint.
When confirmation is needed, continue a planned specimen to its service endpoint and compare observed life with the prediction. One completed trial checks that specimen. Evaluate additional blade specimens to assess blade-to-blade variation and support broader qualification.
Plan test order to reduce time-related bias. Where practical, randomize independent runs or balance them within comparable material batches and machine conditions. Repeated cuts with one blade do not replace independent blade specimens. Report specimen count, averages, and spread, with the level of uncertainty appropriate to the decision.
Finish with a clear disposition: accept the tested configuration, continue evaluation, or revise a documented parameter and retest. Retain the setup, raw measurements, conditioning record, quality evidence, exceptions, and stopping reason. State precisely which results were measured and which were projected.
Frequently Asked Questions
There is no universal cut count. The test must produce enough measurable wear and quality observations to answer the stated question. Choose its extent and number of blade specimens from expected variation, required confidence, and the consequences of an incorrect decision.
Measure both. The incoming measurement records the new blade. The post-conditioning measurement starts the measured cutting test. Keep conditioning time, material use, and wear separate, then include their costs when evaluating the complete production process.
Yes, when evaluating each blade’s productive operating conditions under the same quality and operating limits. Identify this as a process comparison. For a comparison at one common operating point, control actual feed and document the other conditions.
No. A blade can lose effective sharpness or produce unacceptable cuts before reaching its diameter limit. Wear, cutting load, quality, and usable output must be considered together.
No. It records the observed outcome for the tested specimens and conditions. Production acceptance requires evidence appropriate to the application, including normal variation and the expected service period.
A dependable test connects the blade specification and machine conditions to measurable wear, acceptable cut quality, and usable production output. Keep the procedure consistent, investigate exceptions, and state the limits of each conclusion. That record provides a practical basis for selecting a blade and improving the cutting process.
For broader evaluation guidance and calculation support, visit UKAM’s guide to evaluating and comparing diamond blades.
To discuss a trial with UKAM Industrial Superhard Tools, request applications engineering assistance. Include your material, blade dimensions, machine, RPM, feed, cutting depth, coolant, quality requirements, and available test results. This information helps our team review the setup and recommend an appropriate blade specification or next test.
Trusted by Tens of Thousands of Manufacturers, Laboratories,
Research Institutions Worldwide Since 1990
American Based Manufacturer
Established in 1990
Custom manufacturing
RELATED ARTICLES