






















How to Compare Two Diamond Blades Fairly

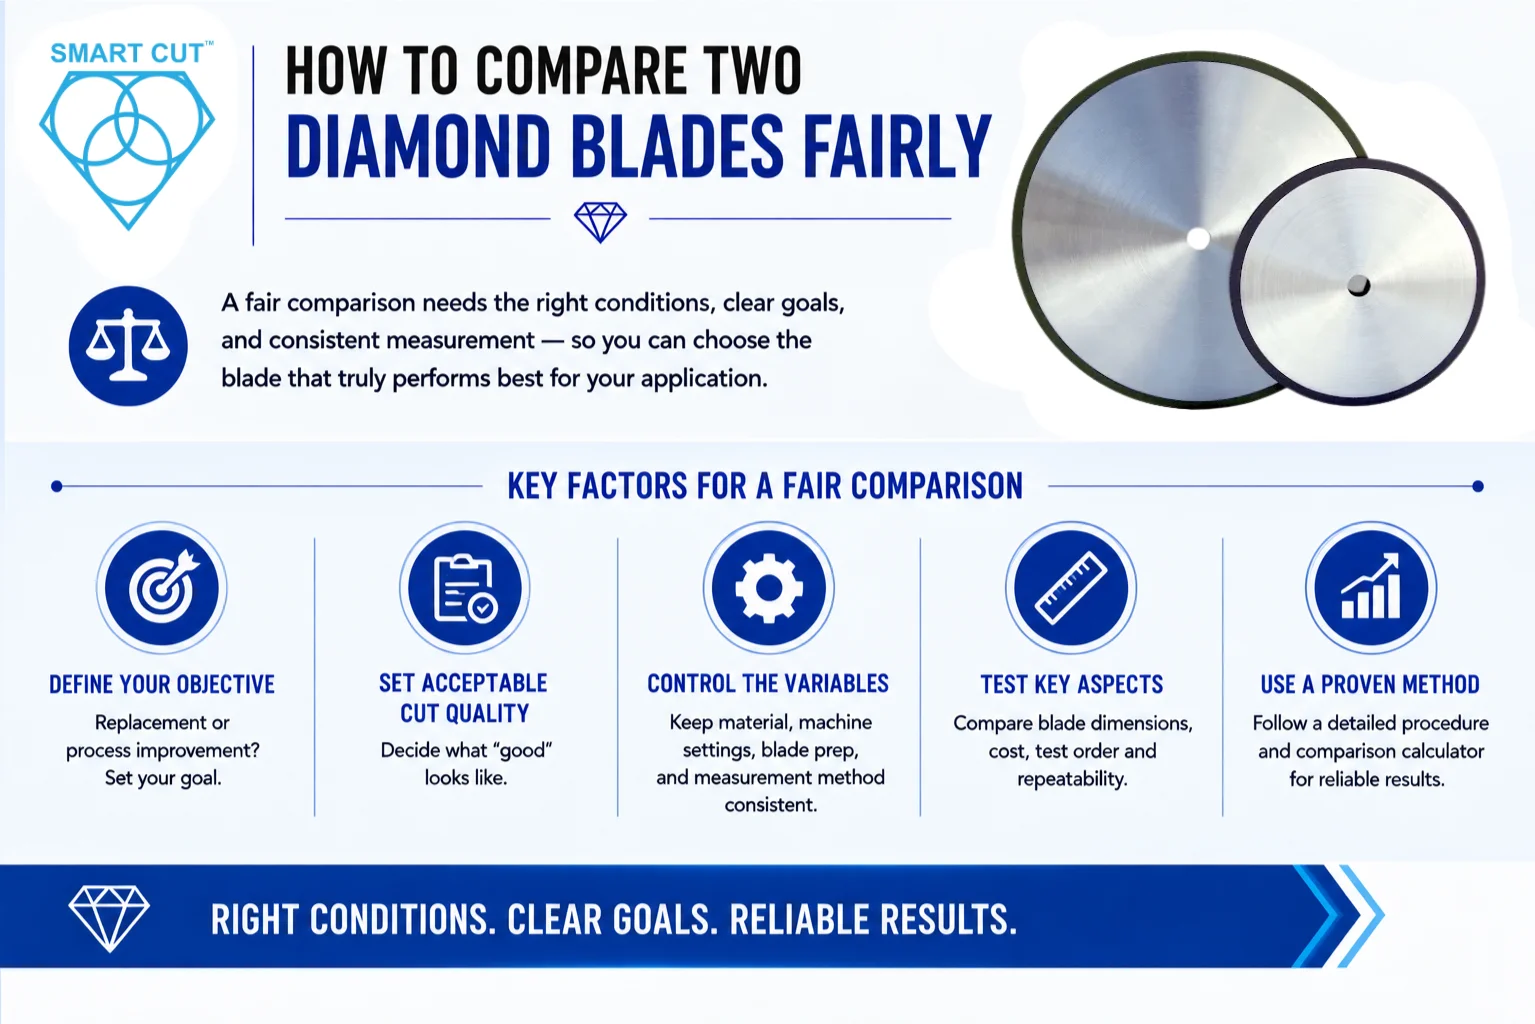
Table of Contents
ToggleA diamond blade comparison can produce misleading results when the material, machine settings, blade preparation, or measurement method changes between trials. One blade may appear to cut faster or last longer because it received more favorable conditions. A purchasing decision then rests on a difference that the test has not adequately explained.
A useful comparison starts with a specific question. Are you selecting a replacement blade for your existing process, or are you willing to adjust the process to improve production? Define that objective, establish acceptable cut quality, and document how you will measure performance before cutting begins.
This article explains how to compare two blade options on a defensible basis. It covers controlled conditions, different blade dimensions, cost, test order, and repeatability. For the full testing procedure and comparison calculator, see UKAM’s guide to evaluating and comparing diamond blades.
Trusted by Tens of Thousands of Manufacturers, Laboratories Research Institutions Worldwide Since 1990

American Based Manufacturer

Established in 1990


Custom manufacturing


Define What You Want the Comparison to Answer

A comparison at fixed settings asks which blade performs better under the operating conditions you intend to keep. Both blades use the same material, machine, workholding, feed setting, cutting depth, and coolant conditions. Any required preparation must be appropriate for both blades. The result supports a decision about that particular setup.
An optimized comparison asks what each blade can achieve when its operating conditions are adjusted within approved limits. You may change feed rate, spindle speed, or dressing intervals for each blade. Both options must meet the same part requirements, and each should receive a comparable opportunity for adjustment. Record the final settings and confirm the results in fresh trials.
These tests answer different questions. An optimized trial evaluates the blade together with its operating conditions. It does not isolate the effect of changing only the blade. Report fixed-setting and optimized results separately, and do not compare an optimized result for one blade against an unoptimized trial for the other.
Set Acceptance Requirements Before Ranking Performance
Decide what constitutes an acceptable cut before assigning a winner. Depending on your application, requirements may include maximum chipping, measured kerf, dimensional accuracy, straightness, surface finish, or freedom from cracks and thermal damage. Define the inspection method and locations as well as the limits.
A blade that fails a mandatory requirement should not become the preferred option because a weighted score rewards its speed or price. First determine whether each option produces acceptable parts. Then compare the qualifying options using cost, throughput, life, and maintenance requirements.
If you use a weighted score, define the weights and scoring scales before testing. Convert measurements to a common score before combining them. Keep the individual results visible so a single score does not hide a trade-off. UKAM’s discussion of diamond blade performance trade-offs explains why no single characteristic determines the best choice.
Control the Material, Machine, and Preparation
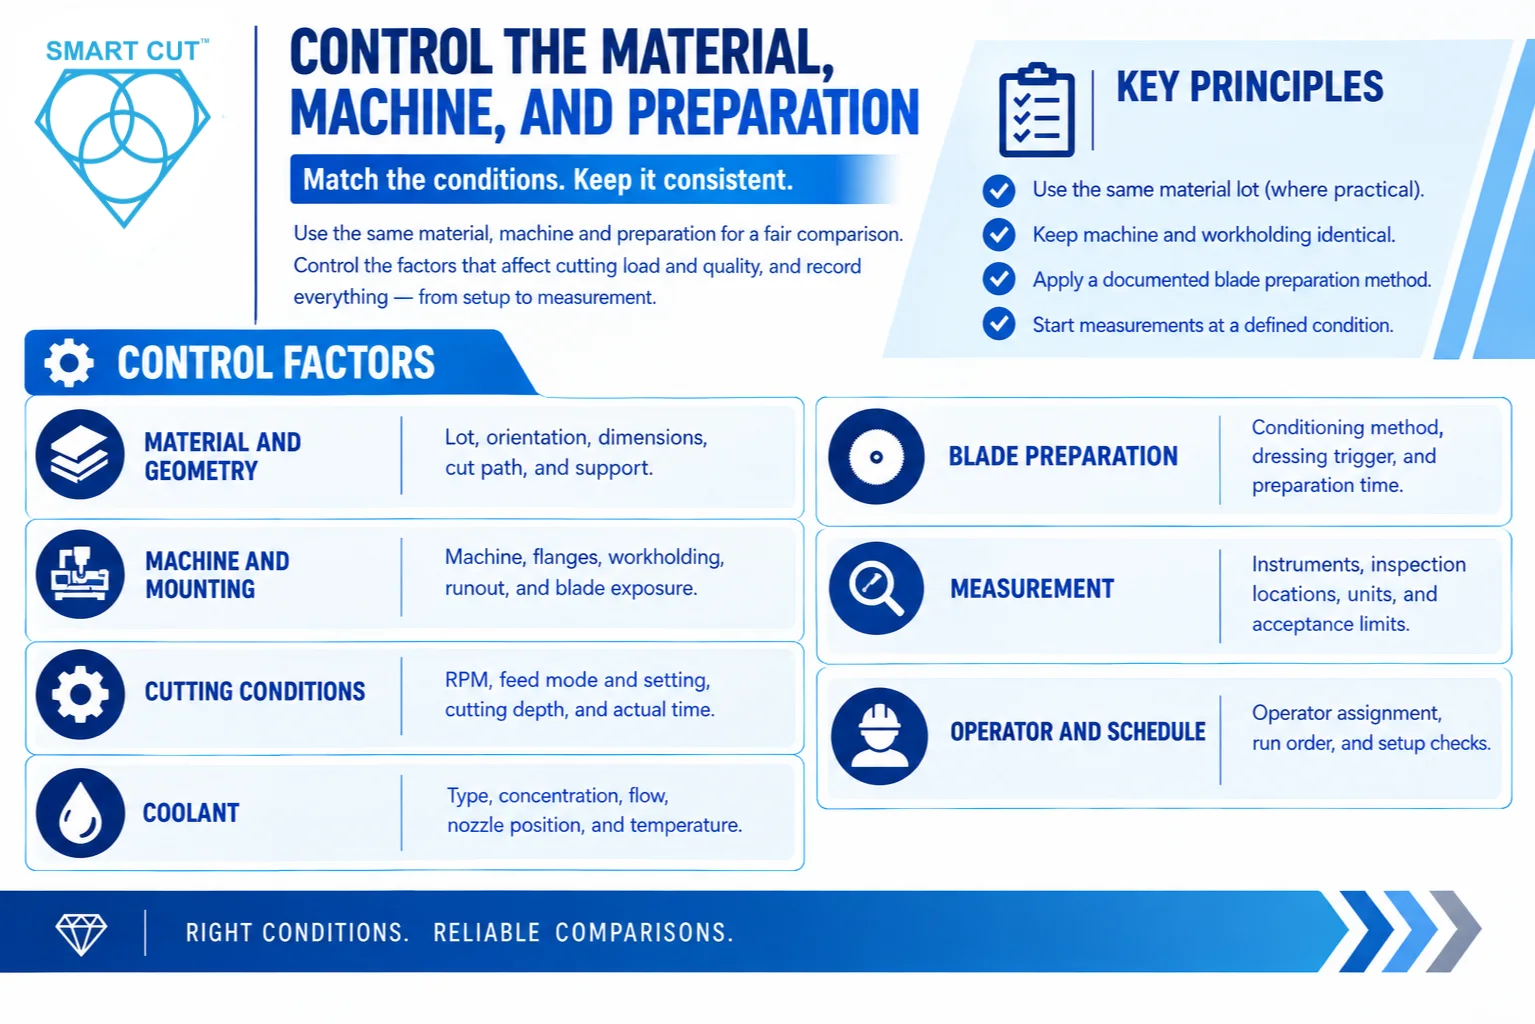
For a comparison at fixed settings, match the conditions that affect cutting load and quality. Use material from the same lot where practical, with comparable dimensions, orientation, and support. Material from one lot can still vary. Distribute representative samples between both options instead of giving all easier samples to one blade.
Use the same machine and workholding arrangement. Check flange cleanliness, blade mounting, runout, workpiece support, and coolant delivery. Record whether the machine controls feed speed or applied load. A constant-load saw does not necessarily maintain a constant cutting speed, so record actual cutting time as well as the load setting.
Prepare each blade using a documented procedure suitable for its construction. Match break-in and dressing when a common procedure is appropriate. If the blades require different conditioning, disclose that difference and include its time, consumables, and wear in the economic assessment. Begin scored measurements at a defined condition, such as stable cutting after initial preparation.
The following controls provide a practical starting point. Apply them consistently with the test objective.
| Factor | What to match or document |
|---|---|
| Material and geometry | Lot, orientation, dimensions, cut path, and support |
| Machine and mounting | Machine, flanges, workholding, runout, and blade exposure |
| Cutting conditions | RPM, feed mode and setting, cutting depth, and actual time |
| Coolant | Type, concentration, flow, nozzle position, and temperature |
| Blade preparation | Conditioning method, dressing trigger, and preparation time |
| Measurement | Instruments, inspection locations, units, and acceptance limits |
| Operator and schedule | Operator assignment, run order, and setup checks |
Compare Different Diameters and Kerfs Carefully
Blades with the same nominal dimensions provide the most direct starting point when you want to compare cutting specifications. When diameter or thickness differs, record the difference and explain how it limits your conclusion. Converting results to common units improves comparison, but it does not remove every physical difference between the blades.
Peripheral speed depends on both diameter and RPM. Two different diameters running at the same RPM have different surface speeds. If your test calls for matched peripheral speed, calculate the required RPM for each blade and stay within the permitted limits of the blade and machine. UKAM’s RPM and feed rate guide explains the relationship.
Matching peripheral speed does not make different diameters mechanically equivalent. Blade engagement, support, and available cutting depth may still differ. Also, outside diameter does not establish usable diamond depth. Record the abrasive rim or layer geometry and the minimum usable diameter for the actual setup.
Measure the kerf produced in the workpiece. Do not assume that the finished groove width equals the nominal blade thickness. Different kerfs change material loss and may affect yield. For precision sectioning, acceptable parts per hour or acceptable cut area per minute can be more useful than material volume removed per minute, which can reward a wider cut simply for removing more material.
Define Useful Blade Life and Comparable Measurements
Define when a blade reaches the end of useful life. The endpoint may be insufficient cutting depth, a wear limit, unacceptable chipping, excessive force, dimensional failure, or an inability to restore performance through the allowed dressing procedure. Apply equivalent production requirements and record the actual reason each blade was retired.
Report total acceptable cuts, cutting time, dressing frequency, measured wear, and reject rate. Keep the units and inspection basis consistent. Cost per cut is comparable only when the cuts represent equivalent work and meet the same requirements. When cut size differs, report an appropriate measure such as cost per unit of acceptable cut area.
Diameter loss per unit of cut area can track wear in comparable blade geometries. It is not a complete correction for different diameters or abrasive constructions. The same diameter loss can represent different volumes of abrasive material lost. Use a geometry-aware wear measure when that distinction is central to the test.
Label projected life separately from measured life. A projection from a short trial assumes that the observed wear behavior continues. Conditioning, later glazing, dressing, or a quality limit can change that relationship. A blade that remains usable when testing stops has a measured operating history, not a measured full service life.
Separate Blade Cost from Total Production Cost
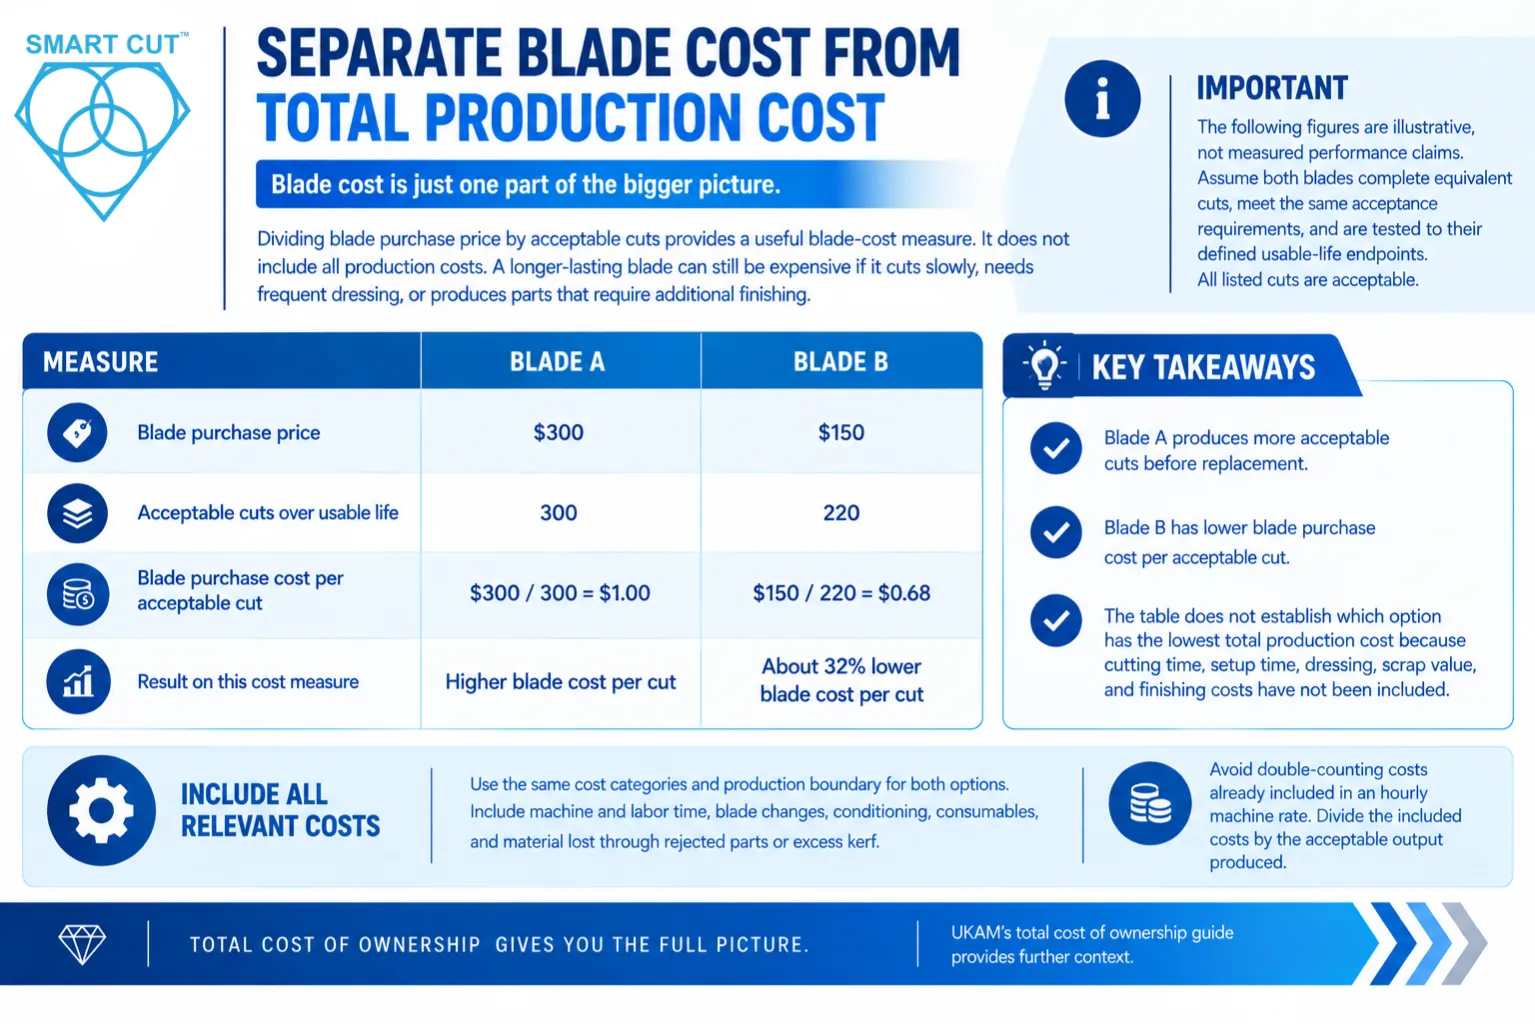
Dividing blade purchase price by acceptable cuts provides a useful blade-cost measure. It does not include all production costs. A longer-lasting blade can still be expensive if it cuts slowly, needs frequent dressing, or produces parts that require additional finishing.
The following figures are illustrative, not measured performance claims. Assume both blades complete equivalent cuts, meet the same acceptance requirements, and are tested to their defined usable-life endpoints. All listed cuts are acceptable.
| Measure | Blade A | Blade B |
|---|---|---|
| Blade purchase price | $300 | $150 |
| Acceptable cuts over usable life | 300 | 220 |
| Blade purchase cost per acceptable cut | $300 / 300 = $1.00 | $150 / 220 = $0.68 |
| Result on this cost measure | Higher blade cost per cut | About 32% lower blade cost per cut |
Blade A produces more acceptable cuts before replacement. Blade B has lower blade purchase cost per acceptable cut. The table does not establish which option has the lowest total production cost because cutting time, setup time, dressing, scrap value, and finishing costs have not been included.
Use the same cost categories and production boundary for both options. Include machine and labor time, blade changes, conditioning, consumables, and material lost through rejected parts or excess kerf. Avoid double-counting costs already included in an hourly machine rate. Divide the included costs by the acceptable output produced. UKAM’s total cost of ownership guide provides further context.
Balance Test Order Without Adding Setup Variation
Running every trial for Blade A before beginning Blade B can make the comparison sensitive to changes over time. Coolant temperature, material condition, machine warm-up, and operator technique may drift. Organize the schedule so those changes do not consistently favor one option.
Use practical test blocks and balance or randomize the order across repeated trials. For example, one matched session can run A before B, and another can run B before A. Define comparable workload blocks and consider blade condition as wear accumulates. Reversing order alone does not correct every source of variation.
Frequent swapping is not always the best approach for thin precision blades. Removal and remounting can introduce variation in runout or alignment. Choose block sizes that limit unnecessary mounting changes, and perform consistent checks after installation. If several operators participate, arrange for each to test both options under the same procedure rather than assigning one operator to each blade.
Evaluate Repeatability and Uncertainty
A small difference between averages does not automatically establish a winner. Examine the spread of results, the number of independent blades tested, and the uncertainty of the estimated difference. Record unusual results and investigate their causes. Do not discard an unfavorable observation simply because it changes the ranking.
Repeated cuts on one blade help show how that blade behaves as it operates and wears. They do not substitute for testing multiple blades when your conclusion concerns consistency across a blade specification. Cuts from the same blade are related observations and should not automatically be treated as independent samples.
A difference between averages can be statistically distinguishable even when it is smaller than the spread of individual results. Sample size and variability both affect uncertainty. Choose an analysis appropriate to the test design and, where practical, report a confidence interval for the difference. The NIST guidance on comparing two means explains how both sample size and variation enter a basic comparison.
Statistical evidence and production value are separate considerations. Decide in advance what improvement would justify a change. When the evidence remains too uncertain, report the comparison as inconclusive rather than declaring the blades equivalent. The number of blades required depends on variability, the improvement you need to detect, and the consequences of a wrong decision.
Keep a Compact Comparison Record
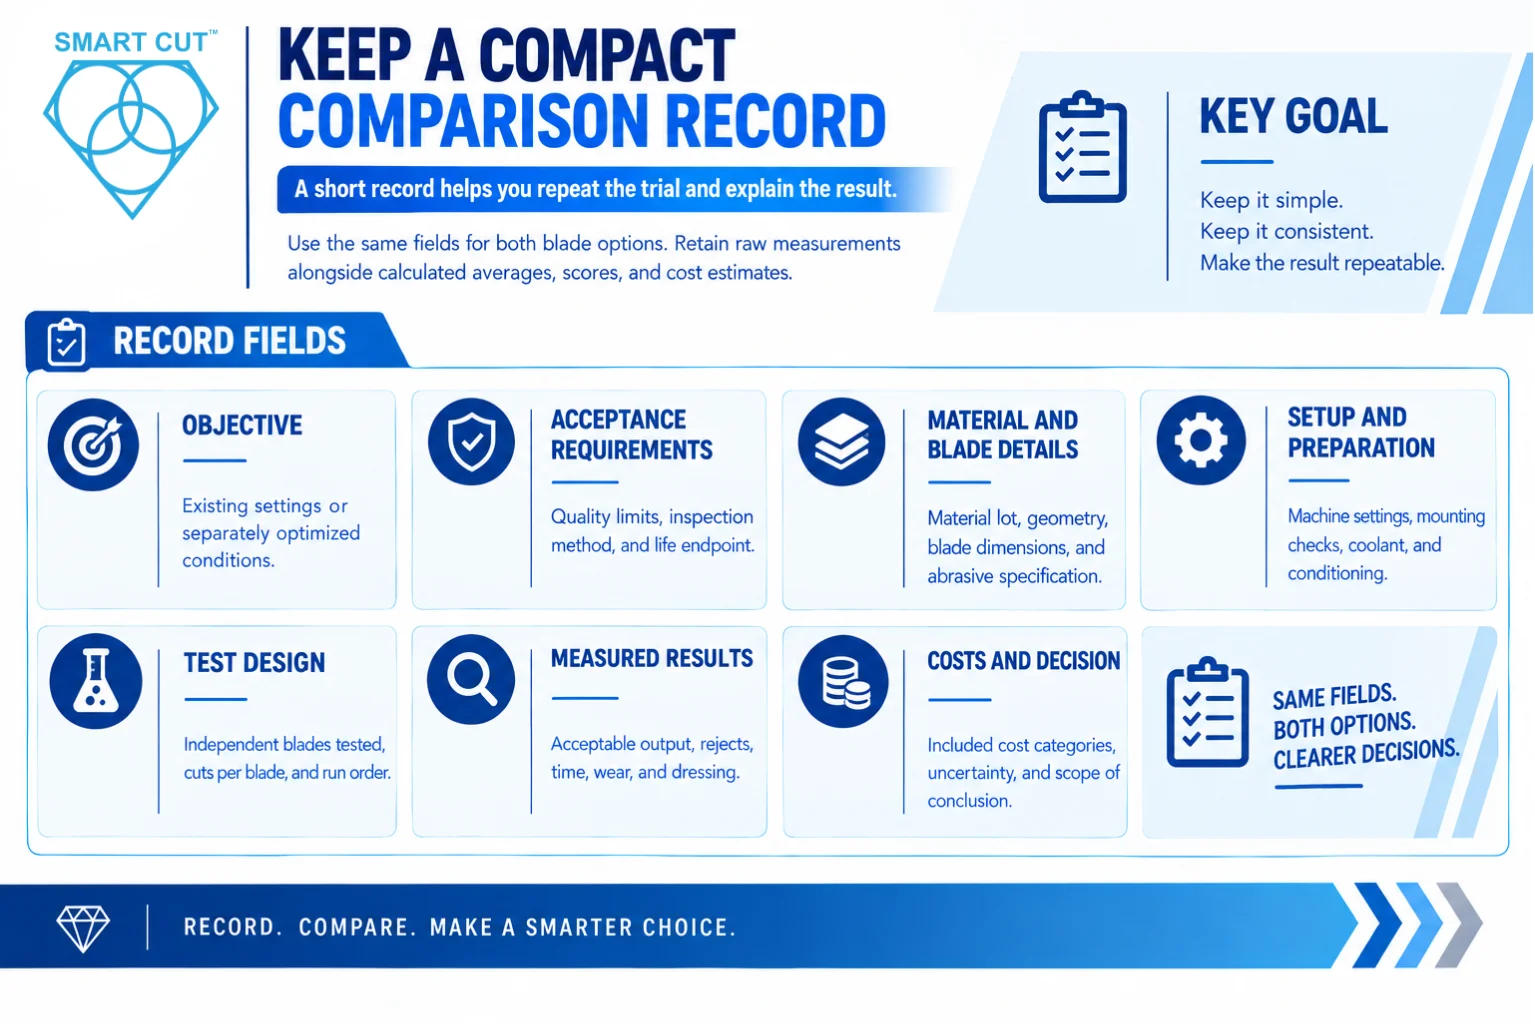
A short record helps you repeat the trial and explain the result. Use the same fields for both blade options. Retain raw measurements alongside calculated averages, scores, and cost estimates.
| Record field | Information to retain |
|---|---|
| Objective | Existing settings or separately optimized conditions |
| Acceptance requirements | Quality limits, inspection method, and life endpoint |
| Material and blade details | Material lot, geometry, blade dimensions, and abrasive specification |
| Setup and preparation | Machine settings, mounting checks, coolant, and conditioning |
| Test design | Independent blades tested, cuts per blade, and run order |
| Measured results | Acceptable output, rejects, time, wear, and dressing |
| Costs and decision | Included cost categories, uncertainty, and scope of conclusion |
Report a Result That Matches the Evidence
State which option met the requirements, the measured difference, and the conditions under which it occurred. Identify whether the result describes fixed settings or optimized operation. Include the sample size, unresolved limitations, and whether life was measured or projected.
A useful verdict may identify the lowest blade cost per acceptable cut, the highest acceptable output per hour, or the most consistent edge quality. Those outcomes can favor different blades. Explain the trade-off and the purchasing criterion instead of presenting a universal winner.
Frequently Asked Questions
Use matched settings when evaluating a replacement within an existing process. For an optimized comparison, document each blade’s final settings and apply the same acceptance requirements. Keep the two types of results separate.
Yes, for a clearly defined production decision. Document geometry, use an appropriate surface-speed basis, and compare equivalent acceptable output. Matching surface speed alone does not remove all diameter-related differences.
No. Outside diameter and usable abrasive depth are separate characteristics. Check the actual rim or layer construction, wear allowance, and minimum usable diameter for the setup.
Only when that procedure suits both constructions. Document any required differences and include conditioning time, dressing consumption, and associated wear in the comparison.
Blade purchase cost per acceptable cut is a useful starting point. A production decision may also require labor, machine time, rejects, material loss, and finishing costs. Compare the same cost categories for both options.
There is no universal number. Plan around expected variability, the improvement you need to detect, and the decision risk. Repeated cuts characterize a blade’s behavior. Multiple independent blades are needed to assess variation between blades.
Check measurement consistency and the uncertainty around the difference. Consider whether the possible improvement matters in production. If the evidence cannot support a choice, document the result as inconclusive and identify what additional testing would resolve it.
Get Help Planning Your Blade Comparison
A well-planned comparison connects blade performance to the requirements of your actual application. It defines the question, controls the relevant conditions, measures acceptable output, and reports the limits of the evidence.
For assistance planning a comparison or reviewing existing results, provide your material, machine, blade dimensions, current operating settings, coolant details, and required cut quality. Include your test results and the improvement you want to achieve. Request applications engineering assistance from UKAM.
Trusted by Tens of Thousands of Manufacturers, Laboratories,
Research Institutions Worldwide Since 1990
American Based Manufacturer
Established in 1990
Custom manufacturing
RELATED ARTICLES