























How to Compare Diamond Blade Suppliers Using Measurable Test Data

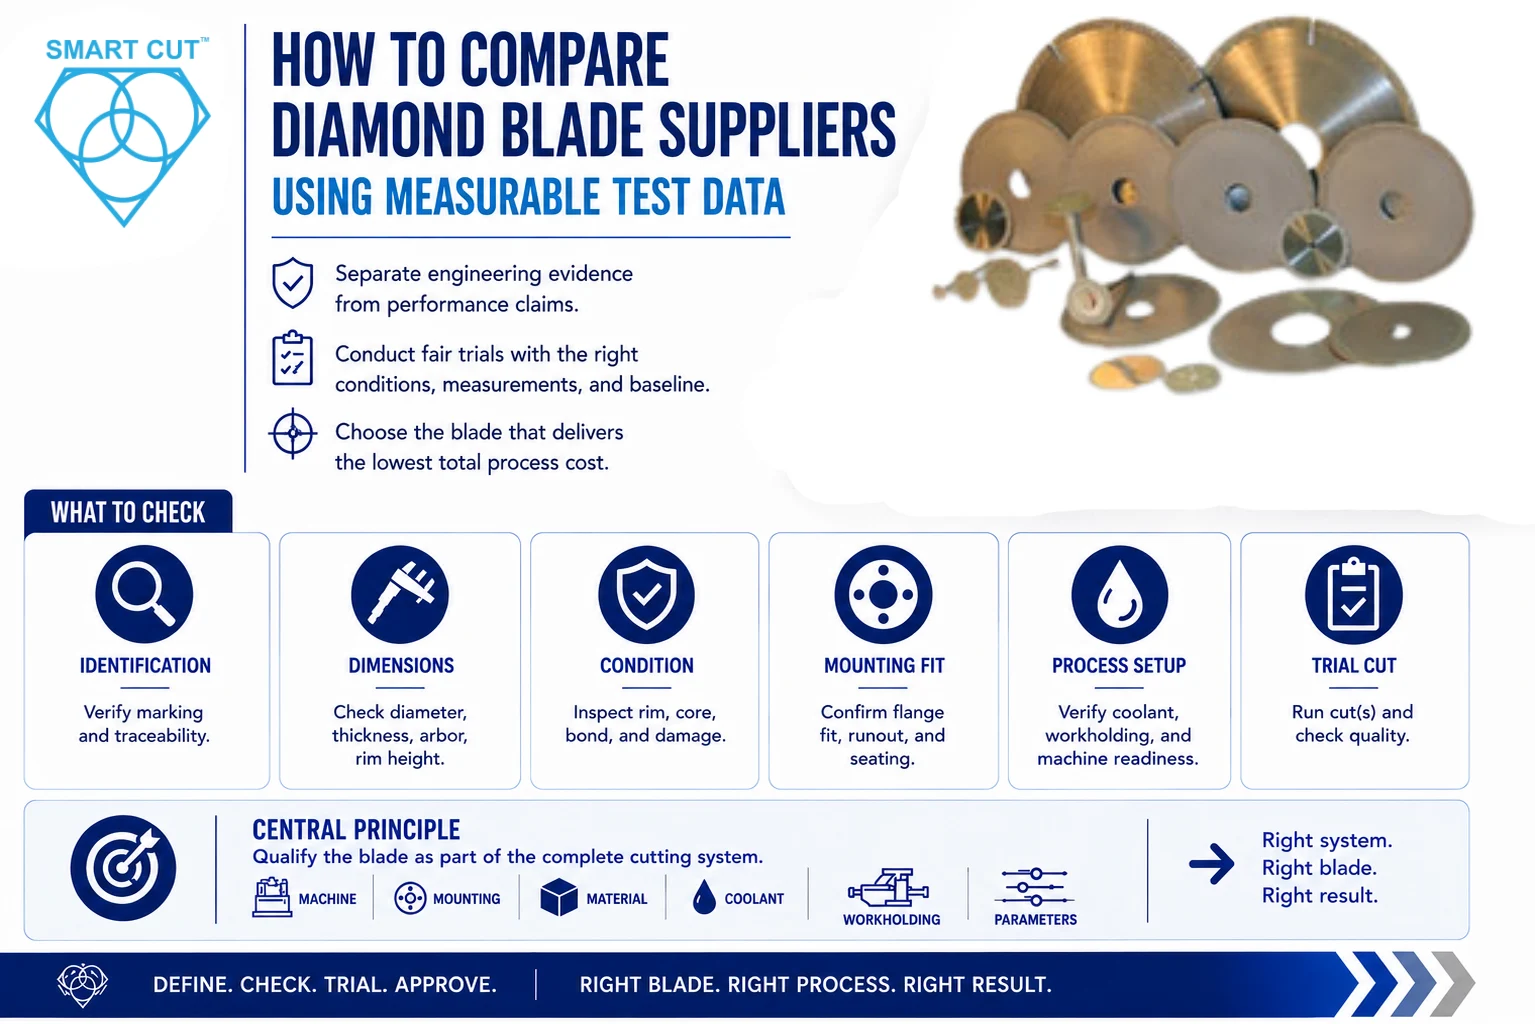
Table of Contents
ToggleA practical method for separating useful engineering evidence from general performance claims, conducting fair trials, and selecting the blade that delivers the lowest total process cost.
When comparing diamond blade suppliers, statements such as “longer blade life,” “faster cutting,” “less chipping,” or “superior performance” are not enough to support a reliable purchasing decision.
Diamond blade performance depends on the complete cutting system. The same blade can produce different results when the material, machine, blade diameter, surface speed, feed rate, cutting depth, coolant delivery, workholding, dressing condition, or inspection method changes.
For that reason, buyers should ask a more useful question:
Core question: What test conditions, measurements, sample plan, and comparison baseline support the supplier's performance claim?
A credible comparison should allow an engineer or technical buyer to understand how the result was produced, what was measured, how much variation occurred, and whether the test conditions represent the intended application. The purpose is not to demand an unnecessarily complicated laboratory study. The purpose is to collect enough controlled evidence to make a technically and economically sound decision.
Trusted by Tens of Thousands of Manufacturers, Laboratories Research Institutions Worldwide Since 1990

American Based Manufacturer

Established in 1990


Custom manufacturing


Why General Performance Claims Are Difficult to Compare
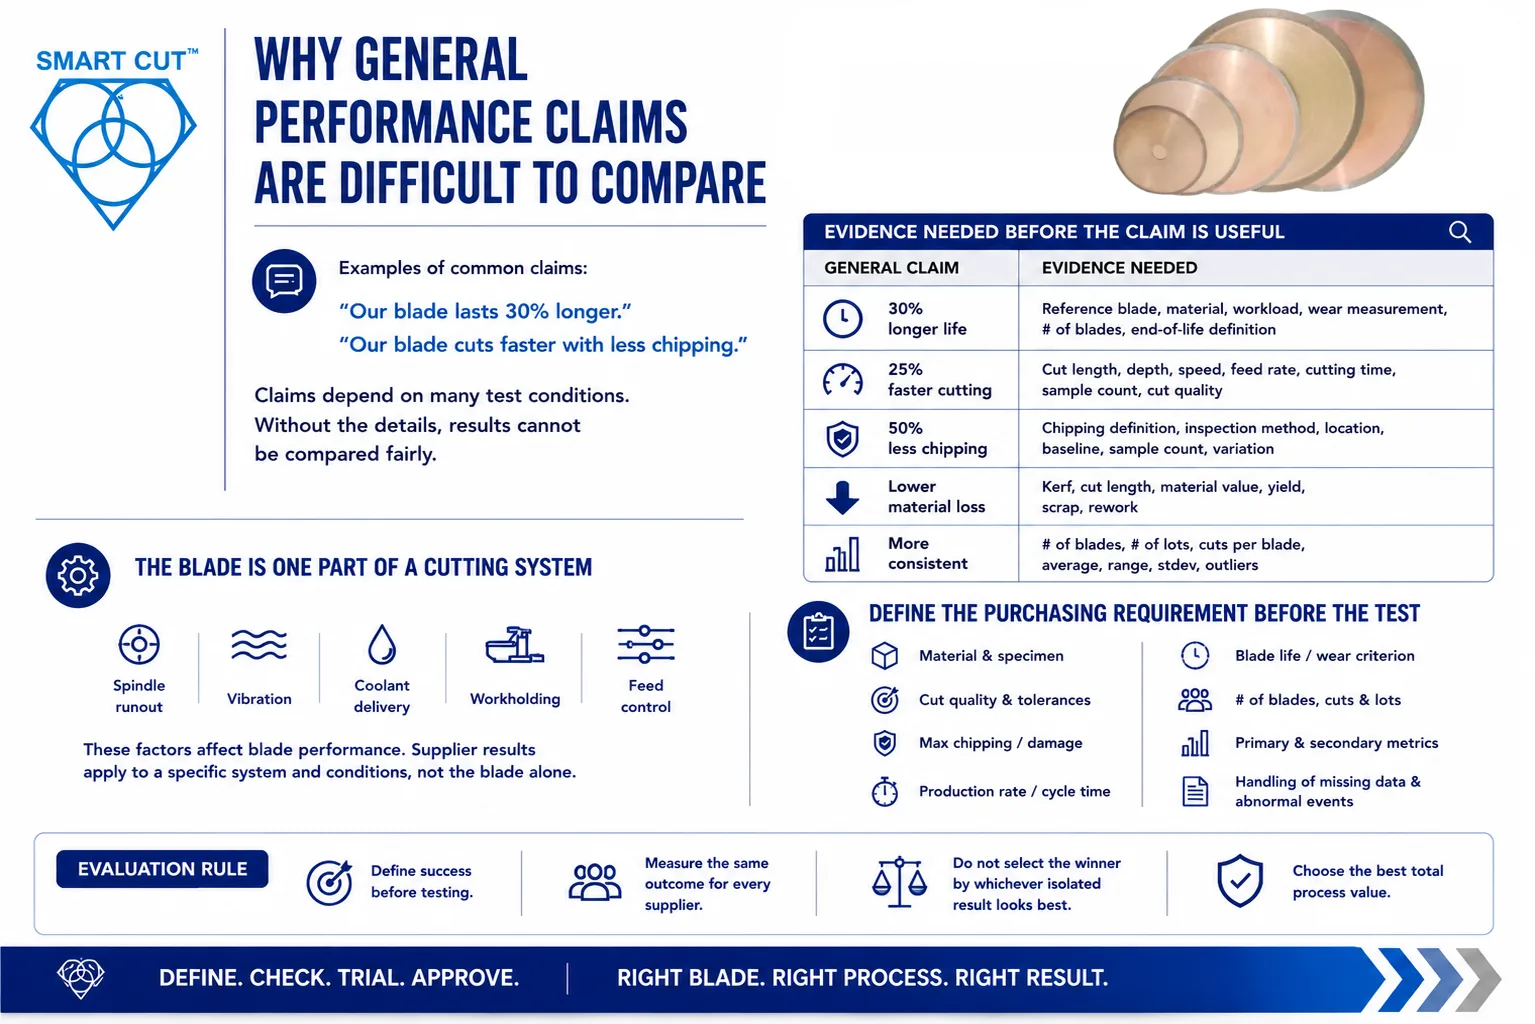
Consider two common supplier statements:
“Our blade lasts 30 percent longer.”
“Our blade cuts faster with less chipping.”
Both statements may be true under the supplier’s test conditions. Neither statement tells the buyer whether the tested material, machine, operating parameters, inspection method, and acceptance criteria are comparable with the buyer’s application.
| General claim | Evidence needed before the claim is useful |
|---|---|
| 30% longer blade life | Reference blade, material, cutting workload, wear measurement, number of blades, and end-of-life definition |
| 25% faster cutting | Cut length, depth, surface speed, feed rate, cutting time, sample count, and resulting cut quality |
| 50% less chipping | Chipping definition, inspection method, measurement location, baseline result, sample count, and variation |
| Lower material loss | Diamond-edge thickness, measured kerf, cut length, material value, yield, scrap, and rework |
| More consistent performance | Number of blades, number of lots, cuts per blade, average, range, standard deviation, and outliers |
The blade is one part of a cutting system
A diamond blade does not operate independently of the machine and process. Spindle runout, vibration, feed control, flange condition, coolant placement, fixture rigidity, and specimen support can influence blade wandering, kerf consistency, edge chipping, thermal damage, and dimensional accuracy.
A supplier result should therefore be understood as the performance of a specific blade within a defined cutting system. A percentage improvement is not an inherent property of the blade unless the comparison method and operating conditions are known.
Define the purchasing requirement before the test
A buyer should establish the required output and acceptance limits before reviewing supplier data or starting a trial. This prevents the test criteria from changing after the results are known.
The written test objective should identify:
● The material, grade, condition, coating, and specimen geometry
● The required cut quality and dimensional tolerances
● The maximum acceptable edge chipping, cracking, or surface damage
● The required production rate or maximum cycle time
● The blade-life or wear criterion that defines end of useful life
● The number of individual blades, cuts, and manufacturing lots to be evaluated
● The primary decision metric and any secondary metrics
● The method for handling missing data, invalid tests, and abnormal machine events
Evaluation rule: Define success before testing. Measure the same outcome for every supplier. Do not select the winner by whichever isolated result looks most favorable after the test.
Document Every Condition That Can Affect the Result
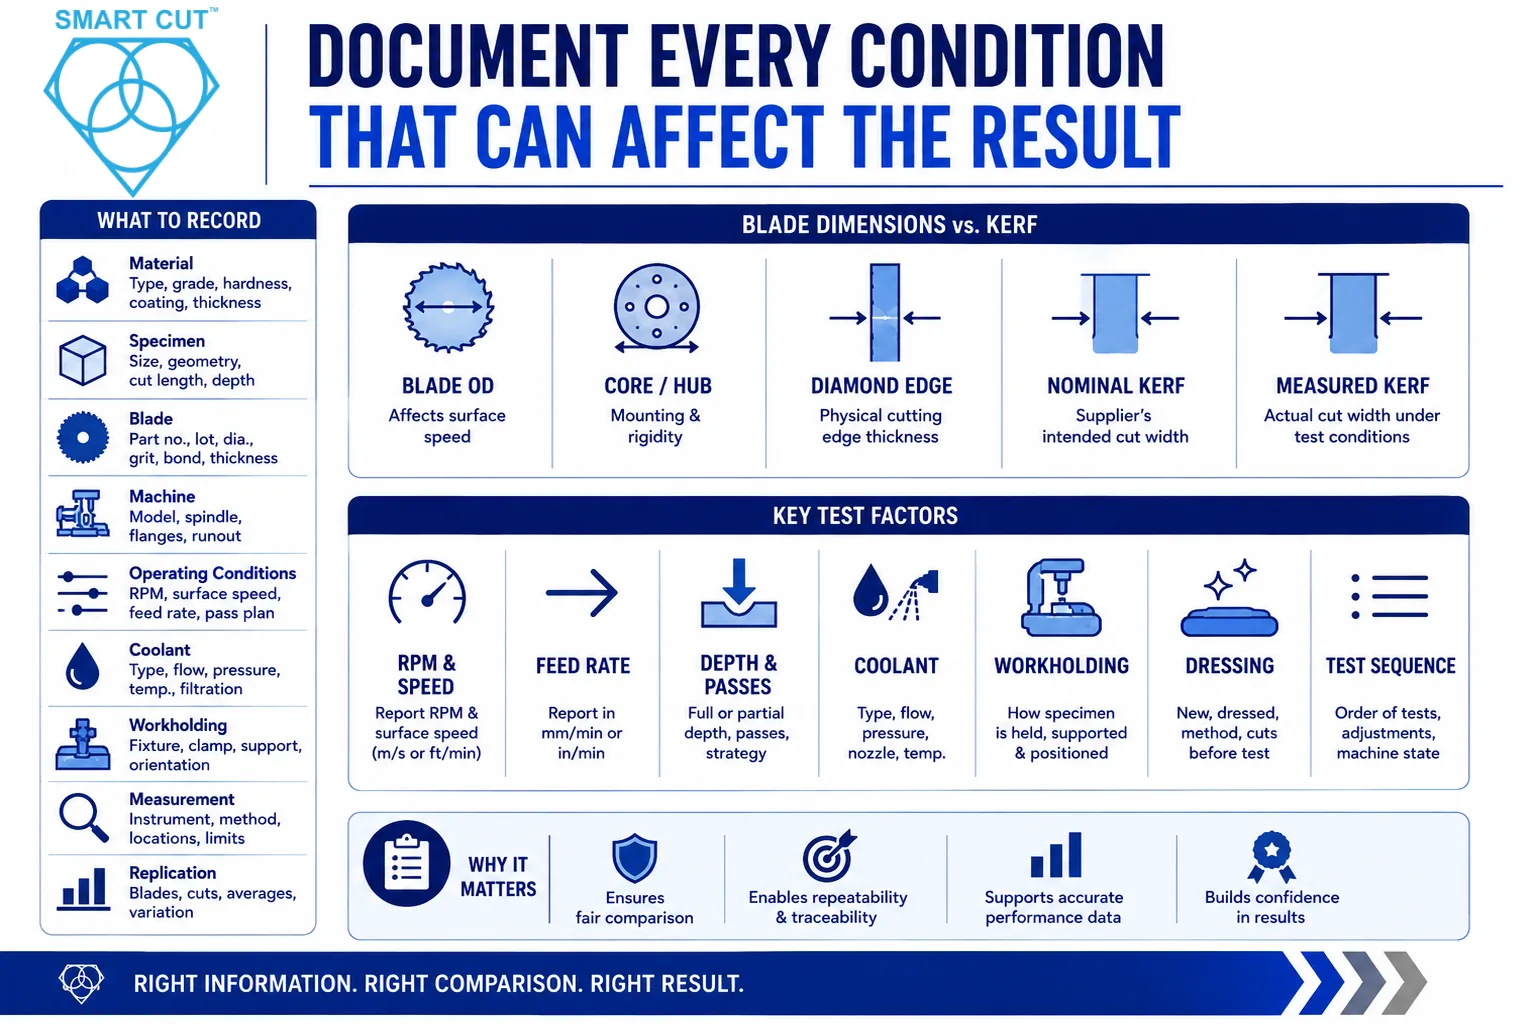
A useful supplier test report should identify the variables that can materially affect blade performance. Not every application needs the same level of documentation. The required detail should reflect the cost of the material, technical risk, production volume, and consequences of an incorrect blade selection.
| Test category | Minimum information to record |
|---|---|
| Material | Material name, grade, hardness or relevant specification, condition, coating, and thickness |
| Specimen | Dimensions, geometry, cut length, cross-section, cutting depth, and number of specimens |
| Blade | Manufacturer, part number, revision, lot, diameter, construction, diamond-edge thickness, grit, concentration where disclosed, and bond family |
| Machine | Machine model, spindle and flange configuration, runout condition, feed system, and relevant maintenance status |
| Operating conditions | RPM, blade surface speed, feed rate, depth, pass strategy, dressing or conditioning, and test sequence |
| Coolant | Type, concentration, temperature where relevant, flow rate, pressure, filtration, nozzle position, and delivery method |
| Workholding | Fixture, support, clamping, orientation, and specimen position |
| Measurement | Instrument, resolution, calibration status, method, measurement locations, and acceptance limits |
| Replication | Number of blades, lots, cuts per blade, averages, ranges, variation, and excluded observations |
Identify the exact material tested
A statement such as “tested on ceramic” or “tested on carbide” is normally too broad for a technical comparison. Where relevant, identify the material using the supplier’s material guide or another recognized material specification.
The report should identify characteristics that materially affect cutting behavior, including:
● Material name, composition, and grade
● Hardness, density, reinforcement, porosity, or crystal orientation where relevant
● Heat treatment, coating, laminate construction, or material condition
● Thickness and orientation relative to the blade
● Lot or batch information when material variation may affect the result
Two materials within the same broad category can respond differently to the same blade. A test on one alumina grade, carbide grade, glass composition, semiconductor material, or composite should not automatically be treated as direct evidence for another grade.
Document specimen geometry and cutting workload
Specimen geometry affects cutting forces, contact length, heat generation, blade wear, and cut quality. The report should identify specimen thickness, length, width, diameter or cross-section, cut length, cutting depth, number of passes, number of specimens, and total number of cuts.
A blade-life claim stated only as “500 cuts” provides little useful information. Five hundred short, partial-depth cuts are not equivalent to five hundred full-depth cuts through a thick specimen. When practical, report total cutting distance, total cross-sectional area cut, or material volume removed in addition to the number of cuts.
Verify the exact blade specification and traceability
At minimum, identify the blade manufacturer, part number, revision, production lot, blade type, diameter, diamond specification, diamond grit size, diamond concentration where disclosed, bond type, and core or rim construction.
A supplier may reasonably protect a proprietary bond formulation or internal manufacturing details. If the complete formulation cannot be disclosed, the test must still identify an exact controlled part number, revision, and production lot so the tested configuration can be reproduced and supplied consistently.
Keep blade thickness and measured kerf separate
Physical blade dimensions and the width of the resulting cut are related, but they are not interchangeable. The physical diamond cutting-edge thickness is measured directly on the blade. Kerf is the width of the cut produced under defined operating conditions.
| Term | What to record | Why it matters |
|---|---|---|
| Blade outside diameter | Measured or specified blade OD | Affects surface speed at a given RPM and available cutting depth |
| Core or hub thickness | Body or hub dimension where relevant | Helps evaluate mounting, rigidity, and clearance |
| Diamond-edge thickness | Physical thickness of the abrasive cutting edge | Should be compared with the blade’s dimensional specification |
| Nominal kerf | Supplier’s intended cut width | Useful for initial process planning |
| Measured kerf | Actual cut width under the stated test conditions | Reflects edge thickness plus runout, vibration, deflection, abrasive protrusion, and process effects |
A measured kerf can be wider than the physical diamond edge. That difference does not by itself indicate that the blade is undersized or defective. The test report should state the measurement method and compare each value with the correct specification.
Include the machine, spindle, flanges, and fixture
The report should identify the machine model and relevant configuration. For precision applications, include spindle runout, flange condition, blade mounting method, feed mechanism, fixture design, specimen support, and any machine settings that could affect the result.
The same blade can appear unstable on a machine with excessive runout or inadequate flange support and perform normally on a properly maintained precision saw. Machine condition should therefore be documented before attributing poor straightness, kerf variation, or chipping to the blade.
Report RPM, surface speed, and feed rate
The supplier should report the actual RPM and feed rate rather than descriptions such as “high speed,” “fast feed,” or “optimized conditions.” RPM alone is not sufficient when blade diameters differ because the cutting-edge surface speed changes with diameter.
Surface speed: Surface speed in m/s = pi x blade diameter in meters x RPM / 60. Surface speed in ft/min = pi x blade diameter in inches x RPM / 12.
Feed rate should be reported in a defined unit such as mm/min or in/min. When comparing productivity, also record cut length, cutting depth, material cross-section, number of passes, cutting time, and resulting cut quality. The word “faster” is ambiguous unless the report distinguishes spindle surface speed from linear feed or traverse speed.
Define cutting depth and pass strategy
Identify whether the test used full-depth cutting, partial-depth cutting, a single pass, multiple passes, or stepped cutting. Cutting workload and thermal conditions can change substantially with depth. A shallow pass should not be compared directly with a full-depth section through the same material without clearly explaining the difference.
Document coolant and workholding conditions
Coolant can materially affect heat removal, swarf evacuation, blade loading, wear, and cut quality. Record the diamond tool coolant type, concentration, flow, pressure, filtration, temperature where relevant, nozzle location, and delivery method. Record the workholding method, including how the specimen was supported, clamped, positioned, and oriented.
Poor or inconsistent workholding can contribute to specimen movement, blade wandering, cracking, edge chipping, kerf variation, and poor cut straightness. This is especially important for thin specimens, brittle materials, laminated composites, semiconductor packages, and small components.
Record blade conditioning, dressing, and test sequence
The condition of the cutting edge at the start of a test can affect early results. State whether the blade was new, preconditioned, dressed, or previously used. Record the dressing material, dressing method, number of conditioning cuts, and the point at which formal measurement began.
Test order also matters. If Supplier A is always tested first, machine warm-up, coolant temperature, operator learning, or fixture wear may unintentionally favor one supplier. Alternate or randomize the sequence when practical, and document any machine adjustment made between trials.
Measure the Outcomes That Matter to the Buyer
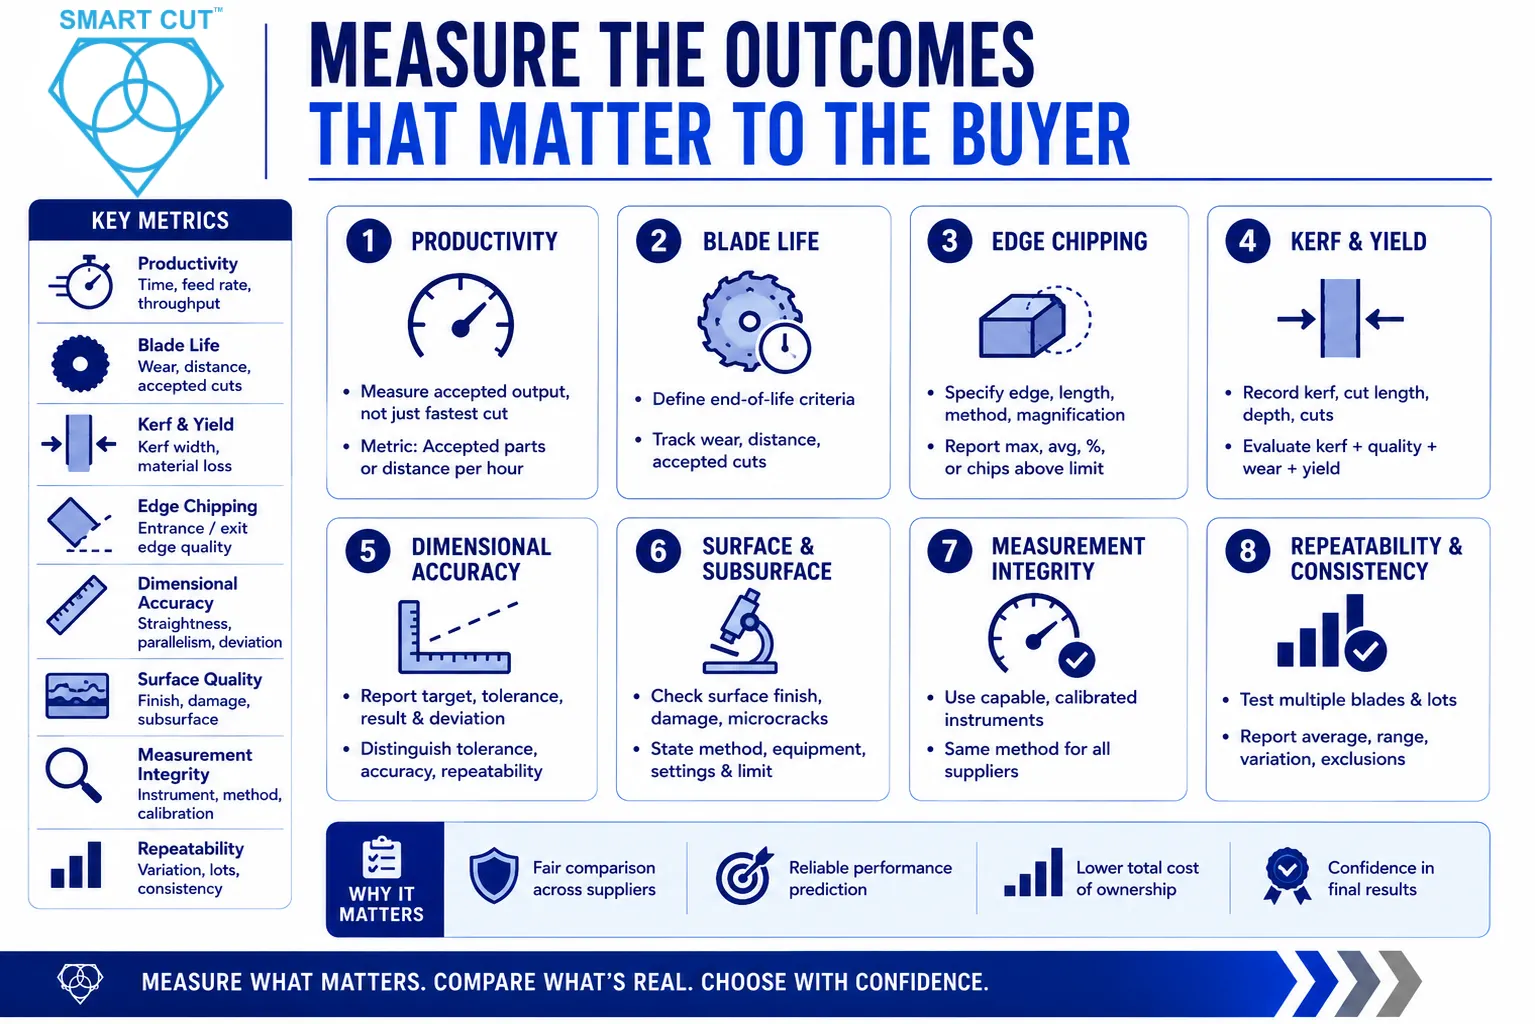
A supplier may provide extensive information while measuring an outcome that has little importance to the application. Select the blade performance metrics that determine whether the cut is acceptable and economical.
Relevant measurements may include:
● Cutting time, feed rate, throughput, and machine utilization
● Blade wear, cutting distance, accepted cuts, and end-of-life point
● Measured kerf, material loss, and usable material yield
● Entrance-edge and exit-edge chipping
● Cut straightness, parallelism, perpendicularity, and dimensional deviation
● Surface finish, smearing, pullout, microcracking, and subsurface damage
● Scrap, rework, downstream finishing, blade changes, and downtime
● Average performance, range, variation, and lot-to-lot consistency
Cutting time and productivity
A faster feed rate is beneficial only if the cut remains within the required quality limits. Compare the time required to produce acceptable output, not merely the fastest isolated cut. For production applications, a useful metric is accepted parts or accepted cutting distance per hour.
Productivity question: How much acceptable material can the blade process within the required time, and how consistently can it do so?
Blade wear and useful life
Blade-life claims should have a defined wear measurement and end-of-life criterion. Depending on the blade design, record initial and final blade diameter, radial wear, rim or segment height, kerf change, cutting distance, accepted cuts, and material volume processed.
The test plan should define whether blade life ends when:
● Cutting time exceeds a stated limit
● Cut quality falls outside the acceptance specification
● Kerf or dimensional accuracy moves outside tolerance
● Radial wear reaches a defined dimensional limit
● The blade can no longer maintain the required geometry
● The blade requires dressing or intervention more frequently than allowed
Without a defined end-of-life criterion, two suppliers can report very different blade-life figures while using different but internally reasonable definitions.
Edge chipping
For brittle and high-value materials, edge quality may be more important than raw cutting speed. A claim of “low chipping” should identify the entrance or exit edge, inspected edge length, inspection method, magnification, number of edges, and acceptance limit.
Report whether the result is the maximum chip size, average, median, percentile, total chipped area, or number of chips above a threshold. Photographs can support the measurement, but photographs alone do not establish a quantitative performance difference unless scale, location, lighting, and selection method are controlled.
Kerf, material loss, and yield
For expensive materials, kerf directly affects material utilization. Record the physical diamond-edge thickness, measured kerf, cut length, cutting depth, number of cuts, material removed, and final usable yield. A thinner blade may reduce material loss, but the advantage can disappear if the blade produces instability, chipping, scrap, or rework.
Evaluate the combination: Measured kerf + cut quality + blade wear + material yield. Do not select a blade based on kerf alone.
Dimensional accuracy and cut straightness
For precision applications, define the target, tolerance, actual result, and deviation. Relevant measurements may include cut width, part thickness, cut location, straightness, parallelism, perpendicularity, and dimensional variation. The report should distinguish tolerance, accuracy, and repeatability rather than combining them under the general phrase “high precision.”
Surface and subsurface damage
Some damage is not visible during normal inspection. Depending on the material and application, evaluate surface deformation, microcracking, subsurface fracture, heat-affected regions, smearing, material pullout, coating damage, and residual stress where relevant.
Possible methods include optical microscopy, scanning electron microscopy, profilometry, metallographic examination, dimensional inspection, and application-specific analysis. The supplier should state the method, equipment, measurement settings, and acceptance limit.
Measurement system and data integrity
The inspection system must be capable of resolving the difference being reported. Record the instrument, resolution, calibration status, measurement method, operator, measurement locations, and uncertainty where appropriate. An instrument with insufficient resolution can make two blades appear equal or create a false difference.
Use the same inspection method for all suppliers. If different laboratories or instruments are used, explain the difference and avoid presenting the results as a direct comparison unless the methods have been correlated.
Repeatability, blade-to-blade variation, and lot consistency
One successful blade does not demonstrate consistent supplier performance. Report the number of individual blades, production lots, cuts per blade, average result, minimum, maximum, range, standard deviation or other appropriate variation measure, and any excluded results.
A large number of cuts from one blade should not be presented as if it were the same as testing many independent blades. Repeated cuts on one blade measure within-blade behavior. Multiple blades and lots provide information about manufacturing consistency. The appropriate sample plan should reflect the technical and financial risk of the purchase.
How to Compare Suppliers Fairly
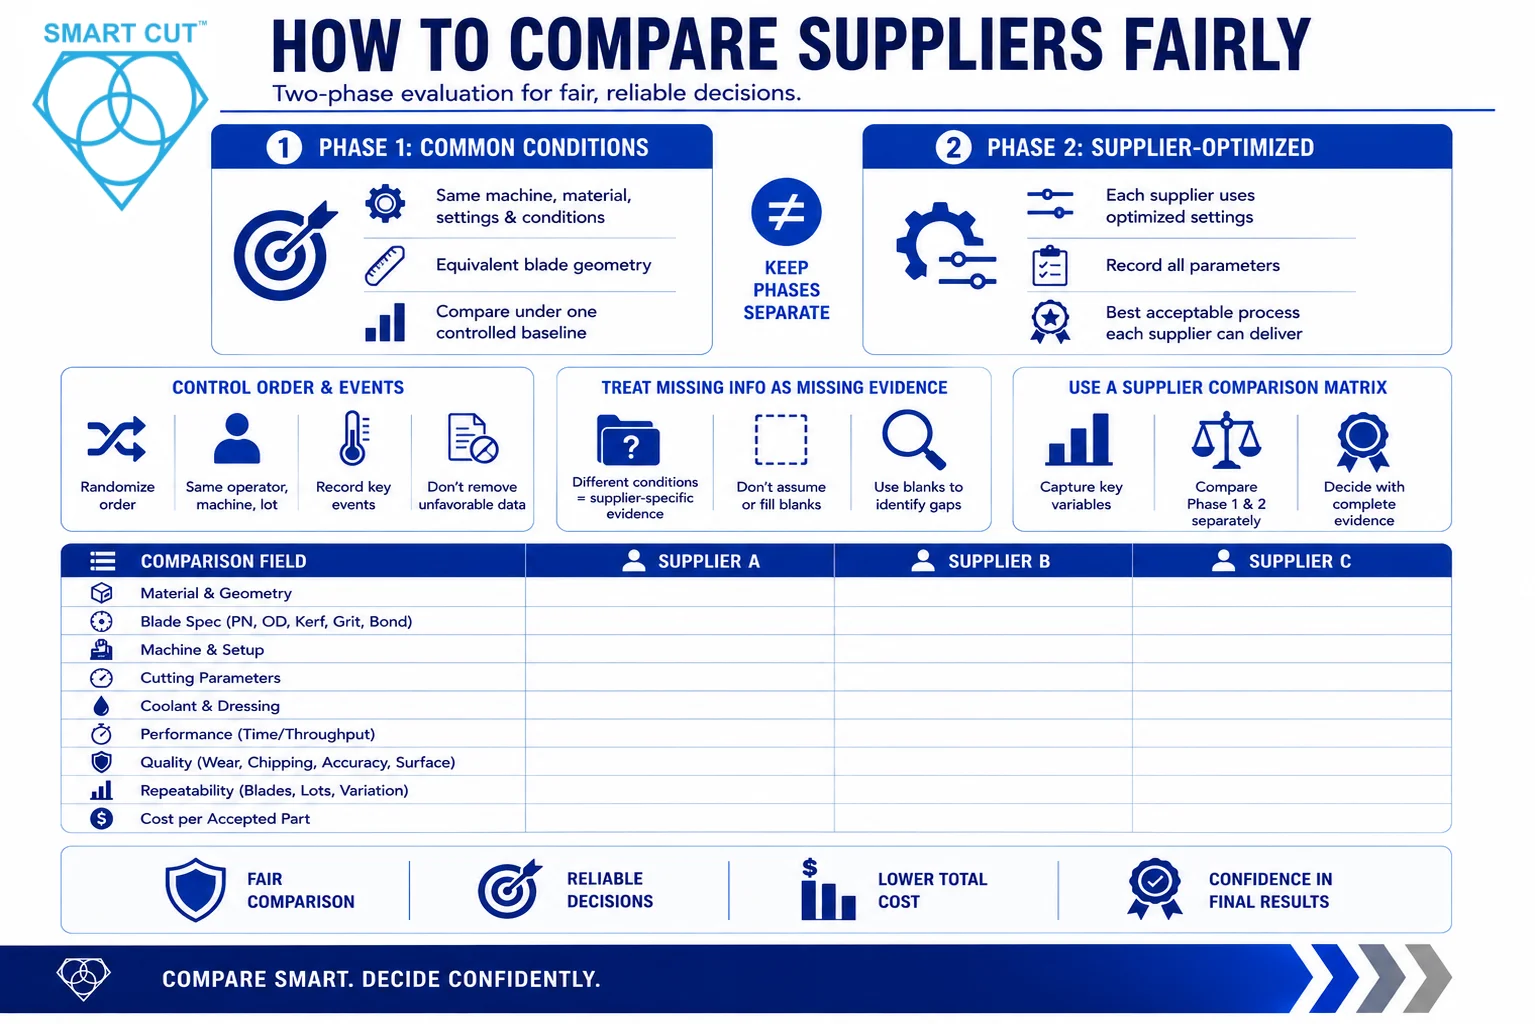
A fair comparison controls the variables needed to isolate the blade’s contribution while also recognizing that different blade designs may require different optimized settings. For that reason, a strong supplier evaluation can use two separate test phases.
Phase 1: Common-condition comparison
Use the same material, specimen geometry, machine, mounting method, surface speed, feed rate, cutting depth, coolant, workholding, dressing condition, inspection method, and acceptance criteria. Use blades with equivalent application geometry where practical.
This phase answers a narrow question: How do the blades compare under one controlled baseline? It helps attribute differences to the blades because the major process variables remain constant.
Phase 2: Supplier-optimized comparison
Allow each supplier to recommend operating conditions within the buyer’s machine limits, safety requirements, production constraints, and quality specifications. Record every parameter and apply the same final acceptance criteria.
This phase answers a different question: What is the best acceptable process each supplier can deliver? It prevents the baseline from unintentionally favoring the blade whose preferred operating window happens to match the selected common conditions.
Evaluate the combination: Measured kerf + cut quality + blade wear + material yield. Do not select a blade based on kerf alone.
Control test order and abnormal events
Alternate or randomize blade order when practical. Maintain the same operator, machine, fixture, measurement system, and material lot. Record spindle warm-up, coolant temperature, dressing events, machine alarms, interrupted cuts, fixture changes, and other events that could affect the result.
Do not remove an unfavorable observation without a documented reason. If a cut is excluded because of a fixture failure, machine alarm, or damaged specimen, retain the original record and state why the result was excluded from the analysis.
Treat missing information as missing evidence
Supplier data may be useful even when the conditions are not identical. However, data from different materials, machines, blade diameters, surface speeds, or inspection methods should be described as supplier-specific application evidence, not as a direct head-to-head comparison.
Do not fill missing fields with assumptions. A blank value is useful because it shows where the evidence is incomplete and where a controlled trial may be needed.
Use a supplier comparison matrix
| Comparison field | Supplier A | Supplier B | Supplier C |
|---|---|---|---|
| Material and grade | |||
| Specimen geometry | |||
| Blade part number, revision, and lot | |||
| Blade OD and diamond-edge thickness | |||
| Nominal and measured kerf | |||
| Grit, concentration, and bond family | |||
| Machine, spindle, flanges, and fixture | |||
| RPM and surface speed | |||
| Feed rate, depth, and pass strategy | |||
| Coolant and delivery | |||
| Dressing and conditioning | |||
| Cutting time and accepted throughput | |||
| Blade wear and end-of-life point | |||
| Edge chipping | |||
| Dimensional accuracy | |||
| Surface or subsurface damage | |||
| Blades, lots, cuts, and variation | |||
| Cost per accepted part |
Worked example: Price per blade versus cost per accepted cut
Hypothetical example: The following figures illustrate the comparison method only. They do not represent a UKAM test result or an actual supplier evaluation.
A buyer compares two 6-inch diamond blades on the same precision ceramic grade. The common-condition phase uses the same saw, material lot, surface speed, feed rate, cutting depth, coolant, fixture, dressing procedure, operator, and inspection method. Each supplier provides three blades. The acceptance limits include maximum edge chipping, kerf range, dimensional accuracy, and cutting-time limits.
| Measured item | Supplier A | Supplier B | Interpretation |
|---|---|---|---|
| Blade purchase price | $165 | $225 | Supplier A has the lower unit price |
| Individual blades tested | 3 | 3 | The comparison does not rely on one blade |
| Average cuts to defined end of life | 200 | 250 | Supplier B processes more cuts before reaching the same end-of-life rule |
| Total cuts | 600 | 750 | Three blades multiplied by average cuts per blade |
| Accepted cuts | 558 | 735 | Cuts meeting all predefined acceptance criteria |
| Accepted-cut yield | 93% | 98% | Supplier B produces fewer rejected parts |
| Average cutting time | 42 sec | 38 sec | Supplier B produces acceptable cuts faster |
| Measured kerf range | 0.51 to 0.56 mm | 0.48 to 0.51 mm | Compare both results with the predefined kerf requirement |
| Maximum measured chip size | 0.22 mm | 0.13 mm | Supplier B stays below a hypothetical 0.15 mm maximum |
| Average radial wear at 200 cuts | 0.42 mm | 0.30 mm | Supplier B shows lower wear at an equal workload |
The unit price suggests Supplier A is less expensive. That conclusion changes when the buyer includes machine time and rejected material. Assume a machine rate of $90 per hour and a material charge of $20 for each rejected part. The simplified calculation is shown below.
| Cost per accepted cut | Supplier A | Supplier B |
|---|---|---|
| Blade cost | $0.89 | $0.92 |
| Machine time | $1.13 | $0.97 |
| Rejected-material charge | $1.51 | $0.41 |
| Measured subtotal | $3.53 | $2.30 |
Supplier B has a slightly higher blade cost per accepted cut, but its faster cycle time and higher yield reduce the measured subtotal by approximately 35 percent. Labor, coolant, dressing, finishing, downtime, and other costs would still need to be added. The example shows why blade purchase price alone can lead to the wrong decision.
Turn the Data Into a Purchasing Decision
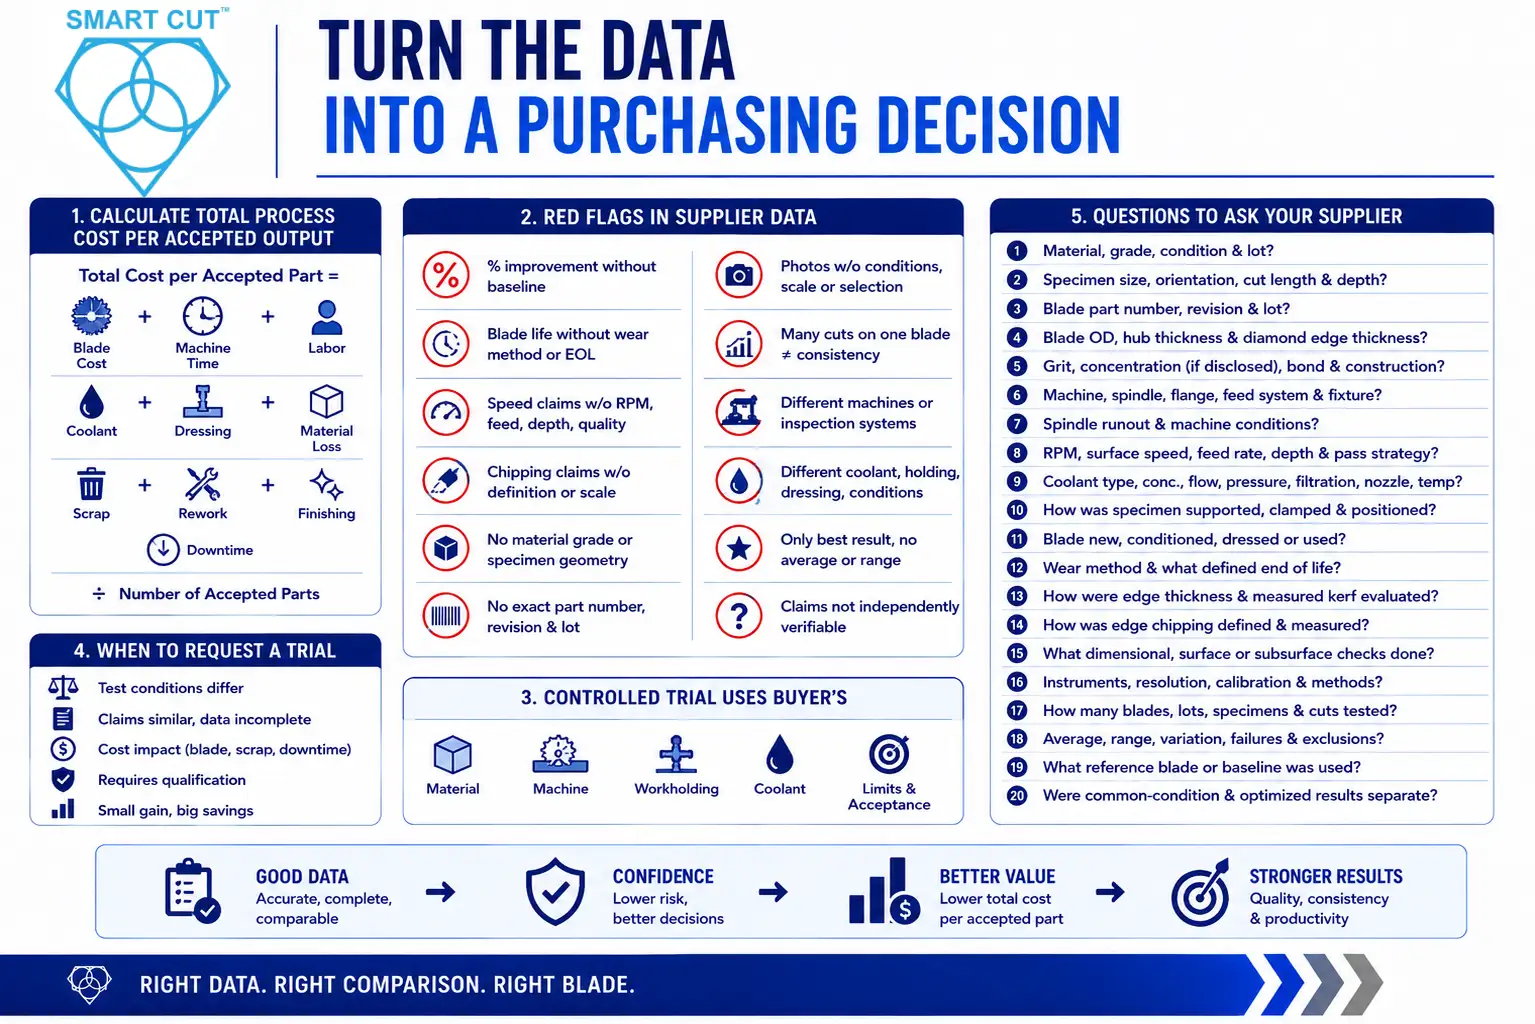
Calculate total process cost per accepted output
The lowest blade price is not necessarily the lowest cutting cost. Use a total cost of ownership calculation that normalizes cost by acceptable output.
Total process cost per accepted part: Total blade cost + machine time + labor + coolant + dressing + material loss + scrap + rework + finishing + downtime, divided by the number of accepted parts.
A higher-priced blade may provide better value if it reduces material loss, damaged specimens, blade changes, downstream polishing, process variation, and machine downtime. The purchasing decision should be based on measured process performance under relevant conditions.
Red flags in supplier performance data
Request clarification when a supplier provides:
● A percentage improvement without identifying the baseline blade
● Blade-life claims without a wear method or end-of-life definition
● Cutting-speed claims without blade diameter, surface speed, feed rate, depth, and cut quality
● Chipping claims without a measurement definition, scale, or inspection location
● Results without the material grade or specimen geometry
● Results without an exact blade part number, revision, and traceable lot
● Photographs without test conditions, scale, or a documented selection method
● Many cuts from one blade presented as evidence of blade-to-blade consistency
● Comparisons performed on different machines or inspection systems without correlation
● Different coolant, workholding, dressing, or operating conditions presented as a direct comparison
● Only the best result without the average, range, failures, or excluded observations
● Claims that cannot be independently reproduced or evaluated
These issues do not automatically mean the blade is unsuitable. They mean the available evidence is insufficient for a strong technical comparison.
When to request a controlled trial cut
Supplier data is most useful when it helps determine whether a blade is worth evaluating. A controlled trial order becomes especially valuable when the material is expensive, specimens are difficult to replace, edge quality is critical, subsurface damage matters, or the decision affects production output.
Use the buyer’s actual material, machine, workholding, coolant, process limits, and acceptance criteria whenever practical. Request a controlled trial when:
● Supplier test conditions differ materially from the buyer’s application
● Two suppliers provide similar claims but incomplete comparable data
● Blade consumption, scrap, or downtime materially affects operating cost
● The application requires qualification before production release
● A small performance difference could create substantial annual savings
Questions to send a diamond blade supplier
Before comparing quotations or performance claims, request the following information:
1. What exact material, grade, condition, and material lot were used?
2. What were the specimen dimensions, orientation, cut length, and cutting depth?
3. What exact blade part number, revision, and production lot were tested?
4. What were the blade outside diameter, core or hub thickness, and diamond cutting-edge thickness?
5. What diamond grit, concentration where disclosed, bond family, and construction were used?
6. What machine, spindle, flange, feed system, and fixture were used?
7. What spindle runout and relevant machine conditions were recorded?
8. What RPM, blade surface speed, feed rate, cutting depth, and pass strategy were used?
9. What coolant type, concentration, flow, pressure, filtration, nozzle position, and temperature were used?
10. How was the specimen supported, clamped, positioned, and oriented?
11. Was the blade new, conditioned, dressed, or previously used?
12. How was blade wear measured, and what defined the end of useful life?
13. How were physical diamond-edge thickness and measured kerf evaluated separately?
14. How was edge chipping defined, measured, and sampled?
15. What dimensional, surface, or subsurface measurements were taken?
16. What instruments, resolution, calibration status, and measurement methods were used?
17. How many individual blades, production lots, specimens, and cuts were tested?
18. What average, range, variation, failures, and excluded observations were recorded?
19. What reference blade or baseline was used?
20. Were common-condition and supplier-optimized results reported separately?
Comparing diamond blade suppliers using test data does not require every buyer to operate a full research laboratory. It requires a written objective, defined acceptance criteria, complete process conditions, appropriate measurements, enough independent replication for the purchasing risk, and an honest comparison baseline.
Before accepting a performance claim, establish:
● What exact material and specimen geometry were tested?
● What exact blade, revision, and production lot were used?
● What machine, surface speed, feed rate, coolant, workholding, and dressing conditions were used?
● What was measured, and how was it measured?
● How many independent blades and lots were tested?
● How much variation occurred?
● What baseline and acceptance criteria were used?
● What was the cost per accepted part or acceptable cutting output?
When those questions can be answered, a general performance statement becomes useful engineering information. For demanding applications, supplier data should be followed by a controlled trial using the buyer’s material, machine, production constraints, and acceptance criteria.
SMART CUT diamond blades from UKAM Industrial Superhard Tools can be evaluated using this evidence-based approach. Buyers can define their material, machine, required cut quality, production conditions, and measurable acceptance criteria before selecting the appropriate blade configuration.
For an application-specific recommendation, provide the material, thickness, machine configuration, required cut quality, and operating requirements to UKAM’s applications engineering team.
Trusted by Tens of Thousands of Manufacturers, Laboratories,
Research Institutions Worldwide Since 1990
American Based Manufacturer
Established in 1990
Custom manufacturing
RELATED ARTICLES