













How Many Tests Are Needed for Reliable Diamond Blade Results
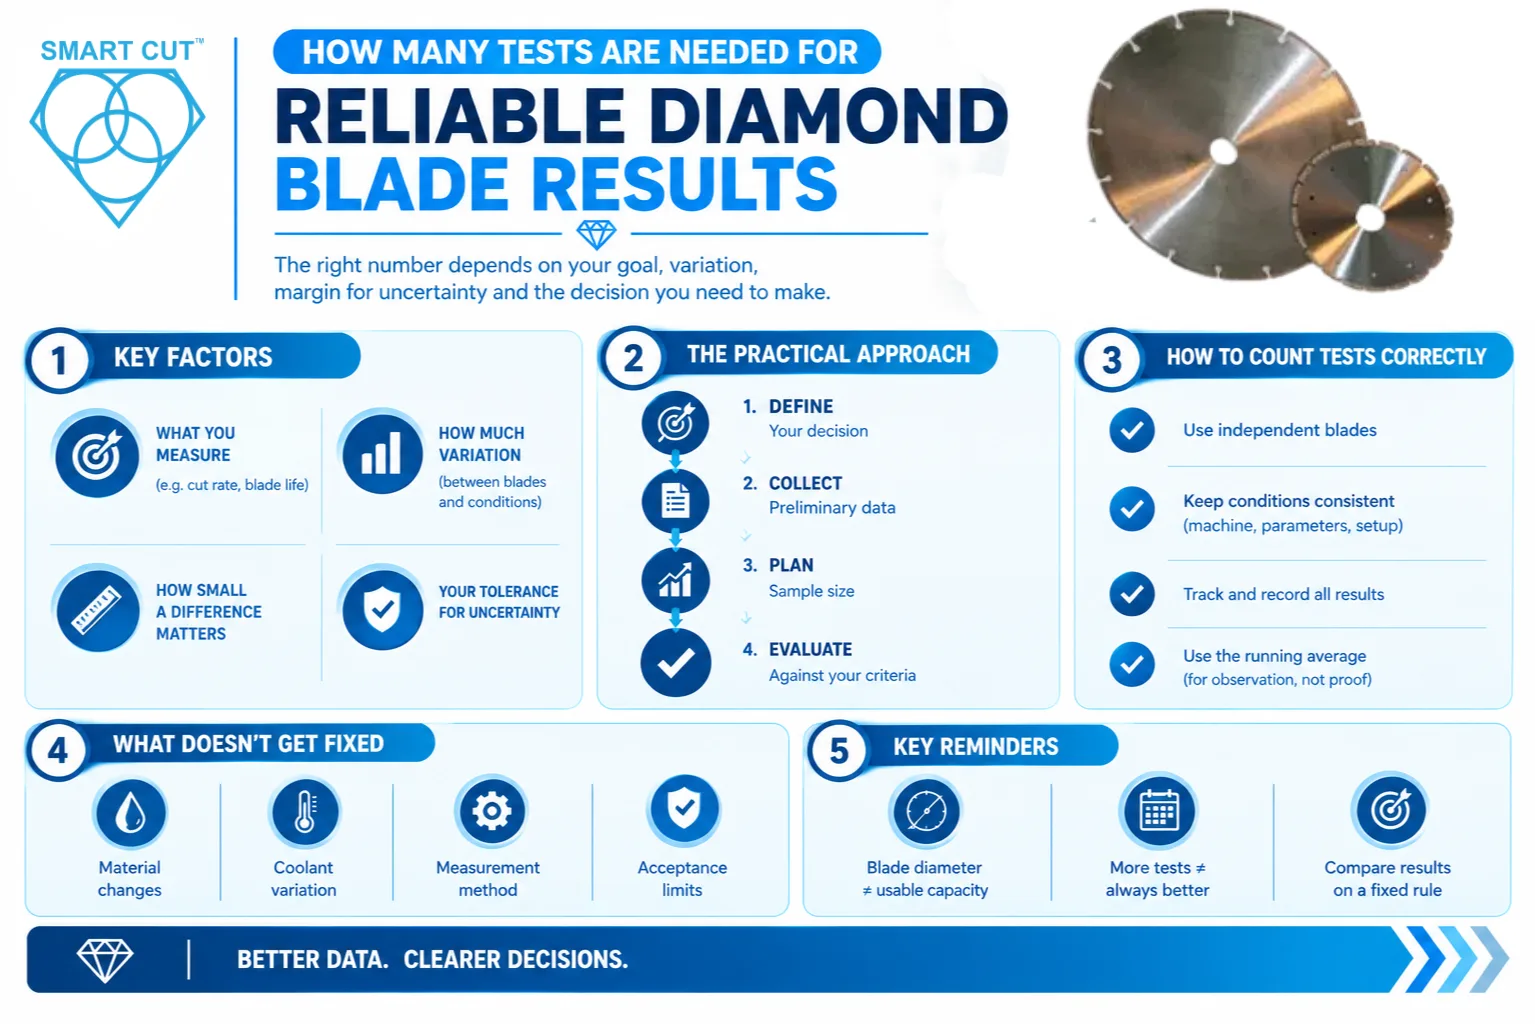
Table of Contents
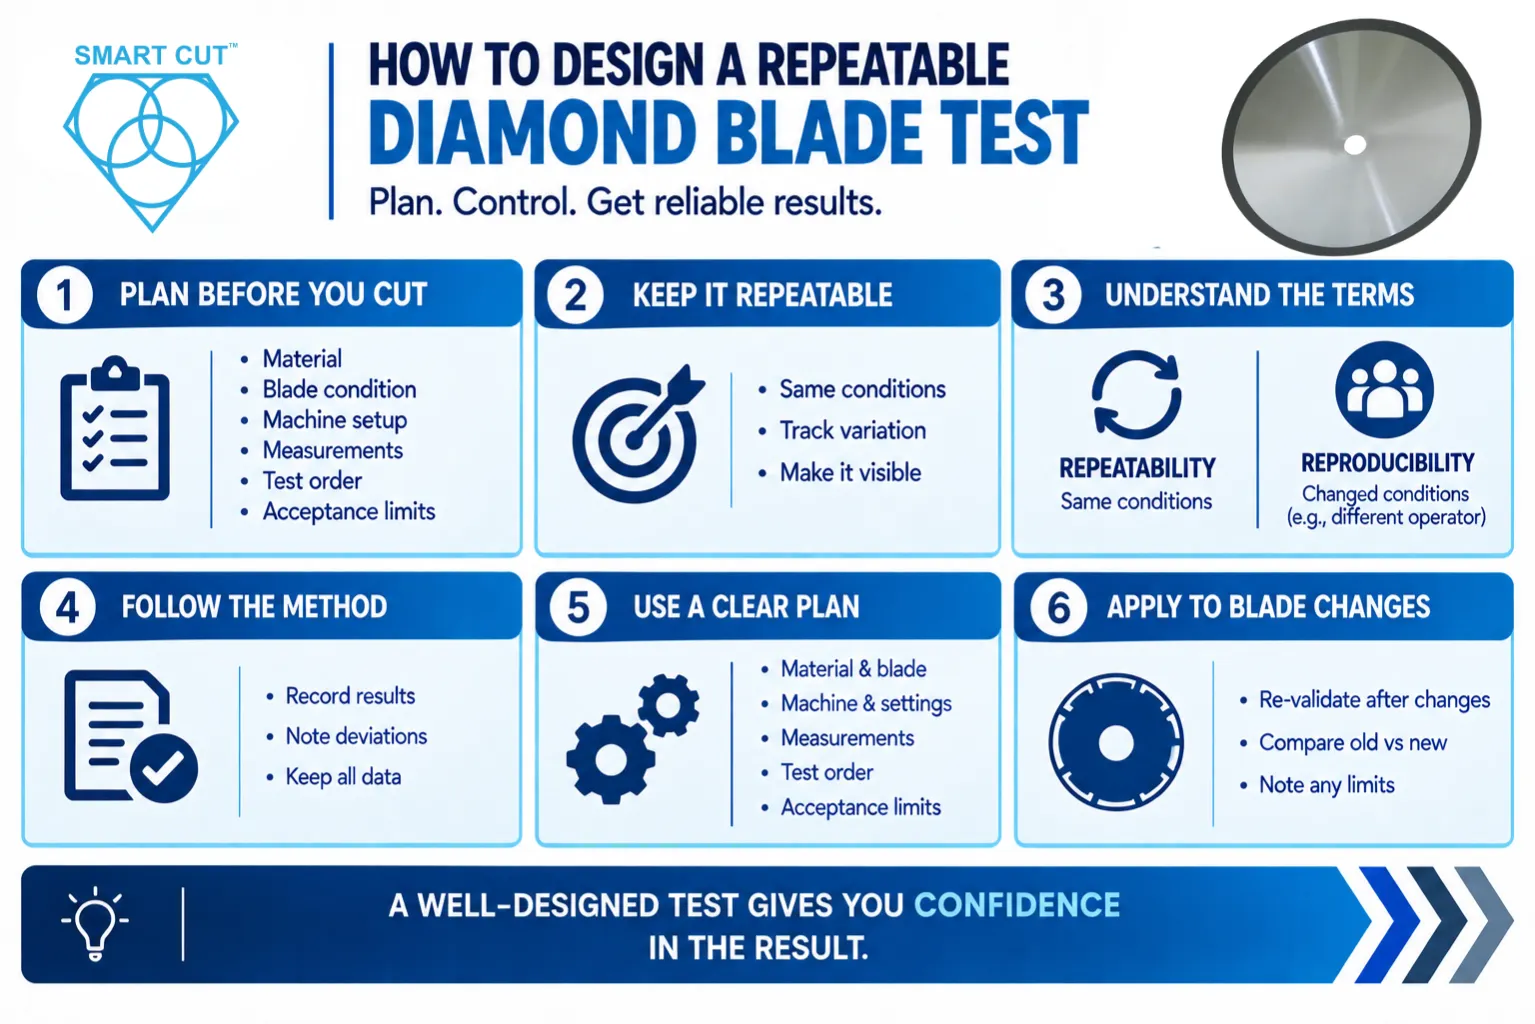
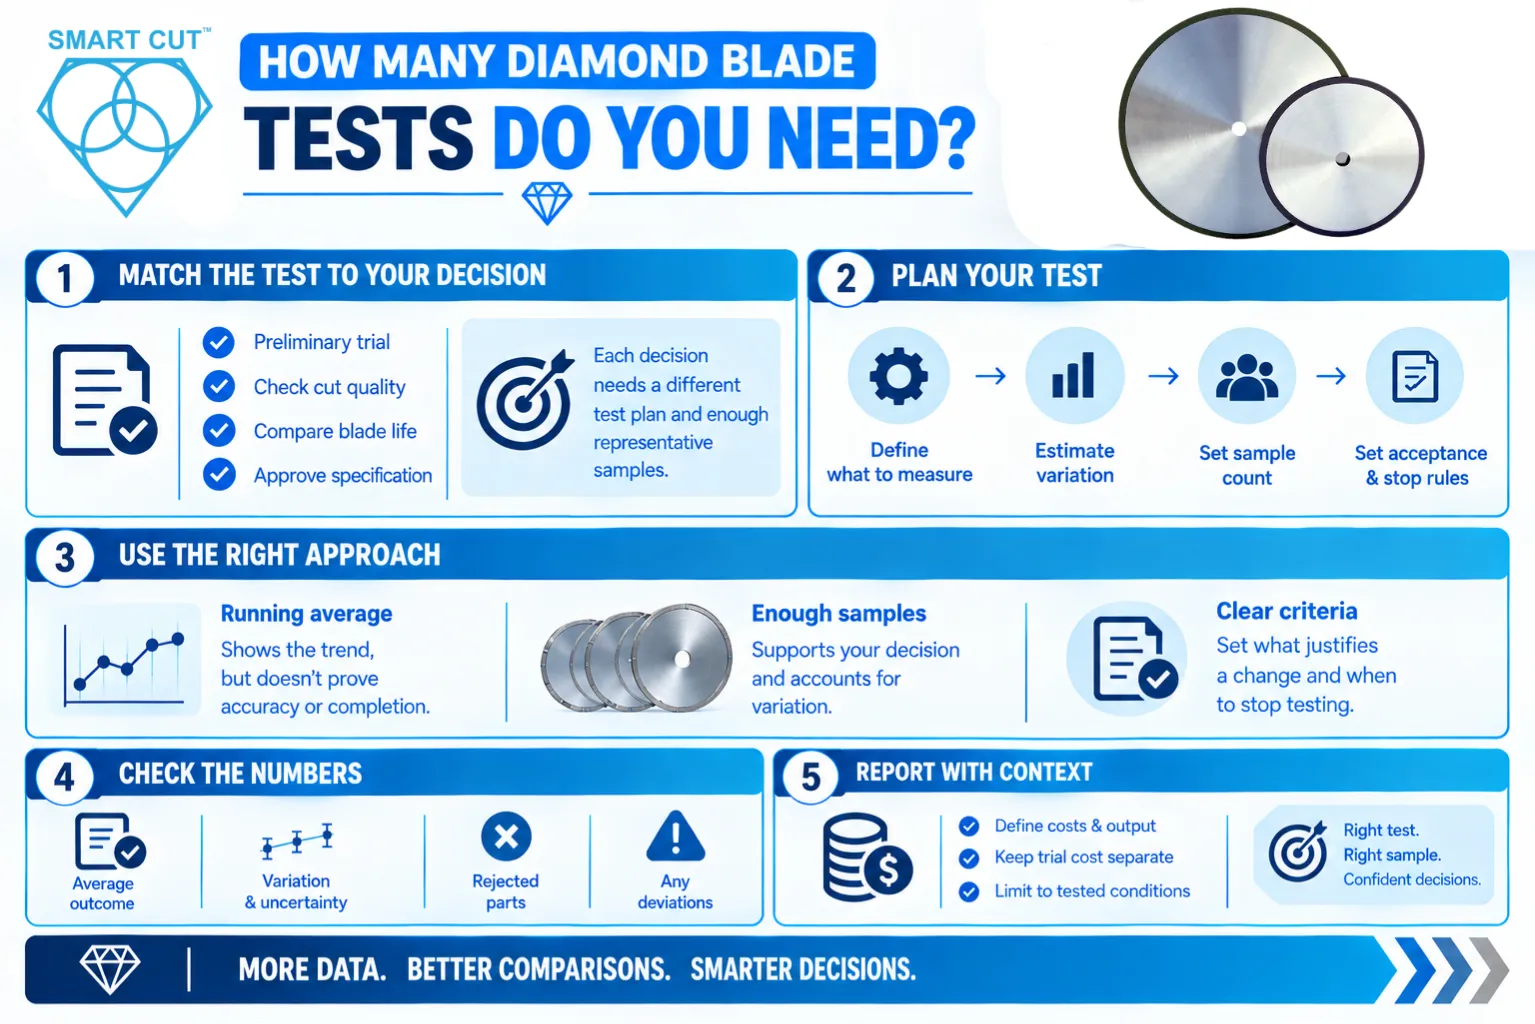
ToggleThere is no single number of diamond blade tests that guarantees a reliable decision. The number depends on what you measure, how much performance varies, how small a difference matters, and how much uncertainty your decision can tolerate.
A practical approach is to define the decision, collect representative preliminary data, and use the observed variation to plan the number of independent blades. Then evaluate the completed test against criteria chosen in advance. A running average that barely changes is useful to observe, but it does not establish that you have enough evidence.
This guide explains how to count tests correctly, estimate sample size, compare blade specifications, and decide whether your results support a production decision. The numerical examples illustrate the method. They are not measured UKAM performance results or universal testing requirements.
Trusted by Tens of Thousands of Manufacturers, Laboratories Research Institutions Worldwide Since 1990
Established in 1990
Define what the testing must establish
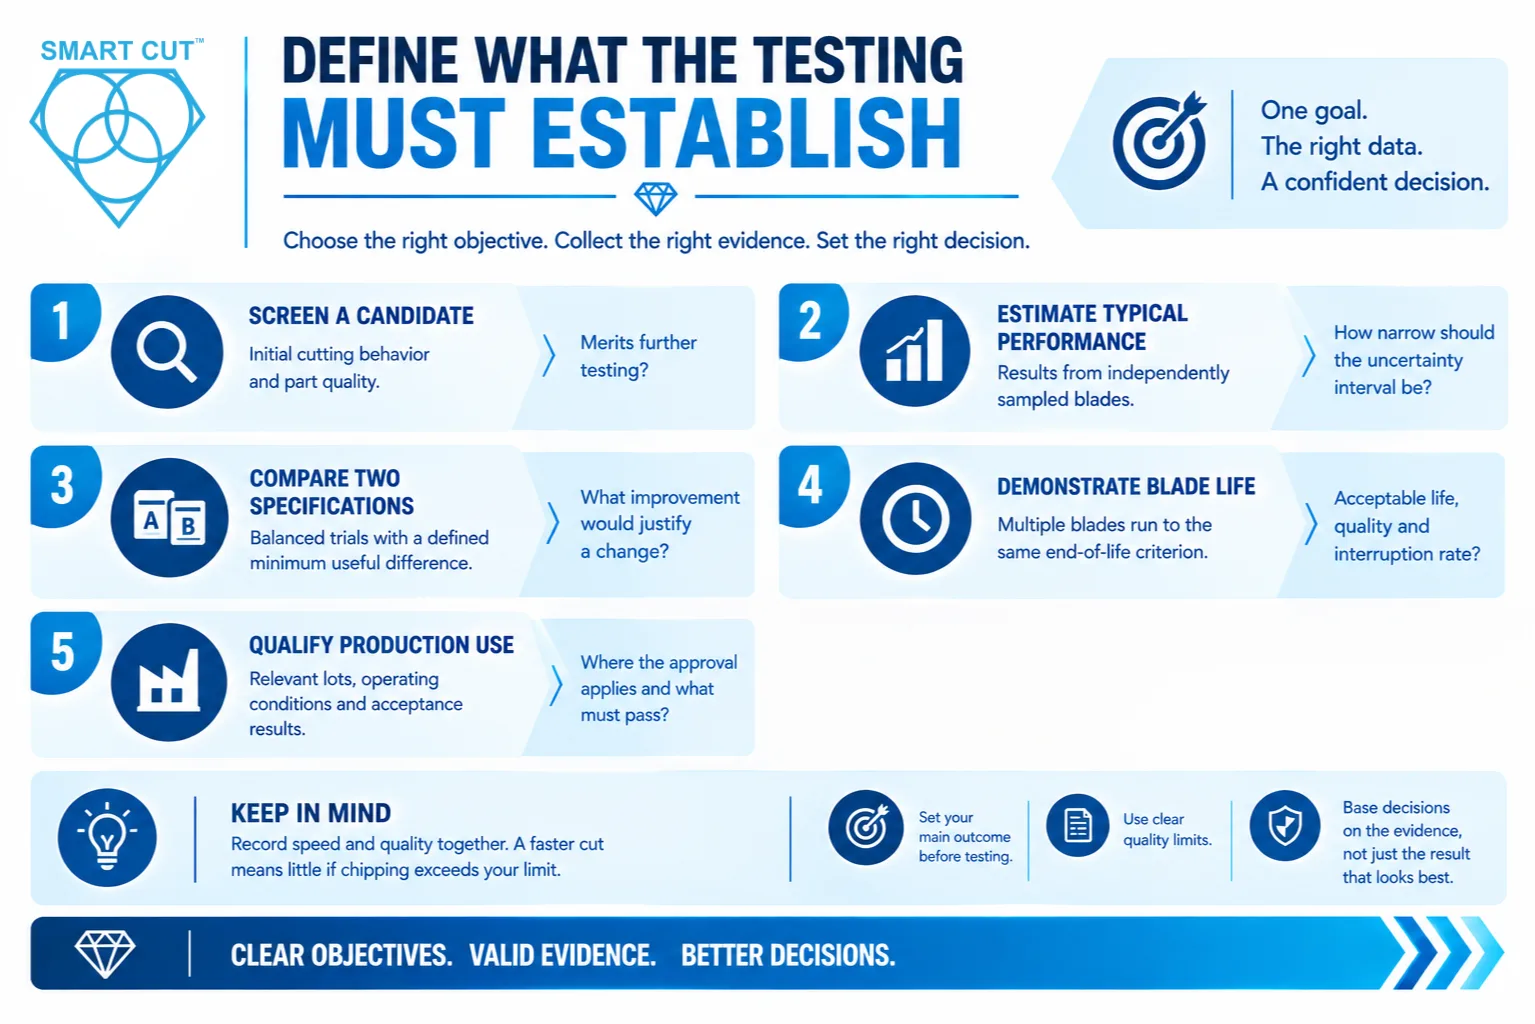
A short trial can reveal an obvious cutting problem. Estimating average performance, demonstrating longer blade life, and approving a production change require different evidence. Choose a primary measurement and define the quality limits that every candidate must meet.
| Testing objective | Evidence to collect | Decision to define |
|---|---|---|
| Screen a candidate | Initial cutting behavior and part quality | Whether the candidate merits further testing |
| Estimate typical performance | Results from independently sampled blades | How narrow the uncertainty interval must be |
| Compare two specifications | Balanced trials with a defined minimum useful difference | What improvement would justify a change |
| Demonstrate blade life | Multiple blades run to the same end-of-life criterion | Acceptable life, quality, and interruption rate |
| Qualify production use | Relevant lots, operating conditions, and acceptance results | Where the approval applies and what must pass |
For example, a faster cut has limited value if edge chipping exceeds your limit. Record speed and quality together. Select your main outcome before testing so that the final decision does not depend on whichever result looks most favorable.
Count blades and cuts separately
Ten cuts on one blade and one cut on each of ten blades answer different questions. Repeated cuts show how one blade behaves within the tested operating window. Multiple blades provide evidence about variation among blades of the same specification.
For a comparison intended to represent a blade specification, the blade is often the independent experimental unit. Cuts are repeated measurements within that blade. Record both counts. A report should say, for example, “six blades per specification, with ten scheduled measurement cuts per blade.” It should not present those 60 cuts as 60 independent blade samples.
A balanced trial uses the same planned number of cuts and the same measurement window for each blade. You can summarize each blade separately, or use a statistical model that accounts for cuts grouped within blades. If material batches, machines, or test days also group the observations, account for those effects.
Choose the right balance
If blade-to-blade differences dominate, additional independent blades usually contribute more than additional cuts on a few blades. If measurements within a blade are noisy, more cuts can improve that blade’s estimate. Start with a balanced pilot when the sources of variation are unknown. A very small pilot gives only a rough estimate of variability.
Understand the three quantities
Standard deviation describes the spread of individual observations. State whether those observations are individual cuts or averages from separate blades.
Standard error describes uncertainty in an estimated mean. For independent observations from a stable population, it is estimated as the sample standard deviation divided by the square root of the sample size.
A confidence interval combines the estimate and its uncertainty. Its width depends on sample size, variability, and the selected confidence level. Under the model assumptions, a method producing 95% confidence intervals covers the true mean in about 95% of repeated studies.
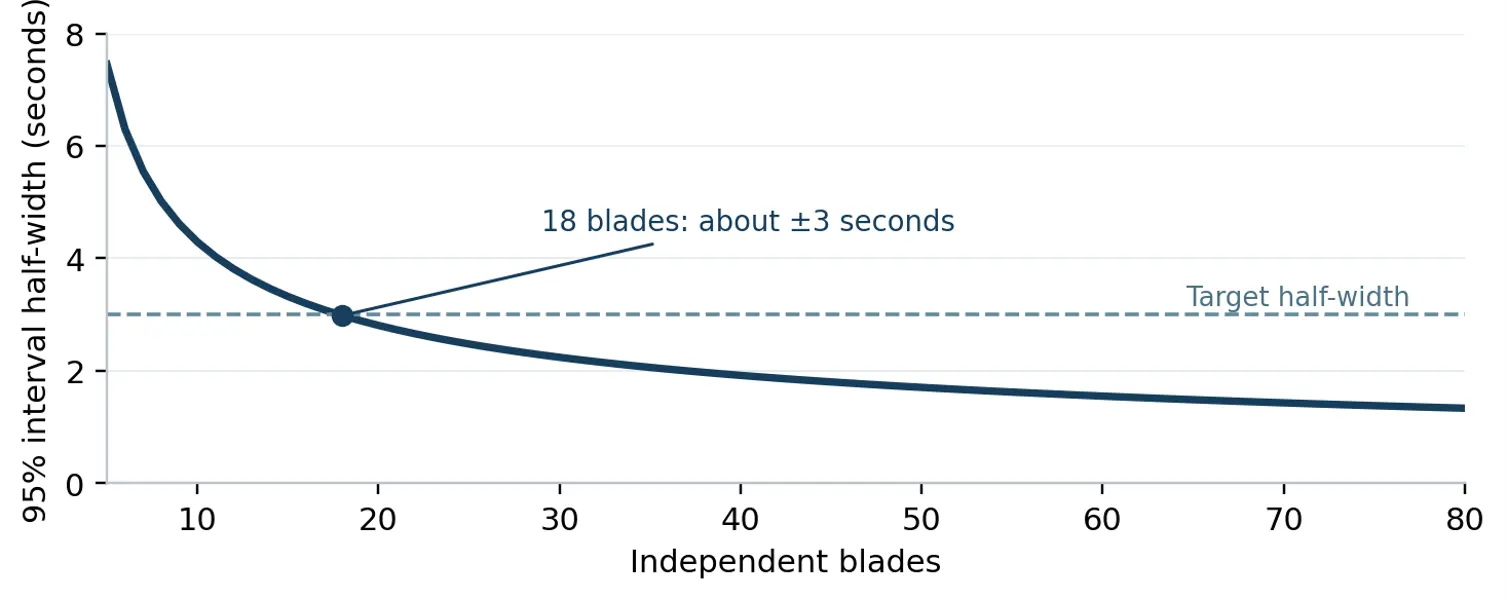
Additional independent samples generally improve precision. They do not automatically reduce cut-to-cut variation or correct a biased measurement method. With variability held constant, doubling the sample size reduces standard error by about 29%. Halving it requires approximately four times as many independent samples.
Use relative variation with care
The coefficient of variation, or CV, equals standard deviation divided by the mean, multiplied by 100%. It can help compare relative variability in positive measurements with a meaningful zero, such as cutting time. It becomes unstable near a mean of zero and is unsuitable for some measurements. A low CV alone does not prove that the test is complete.
Build a representative test plan
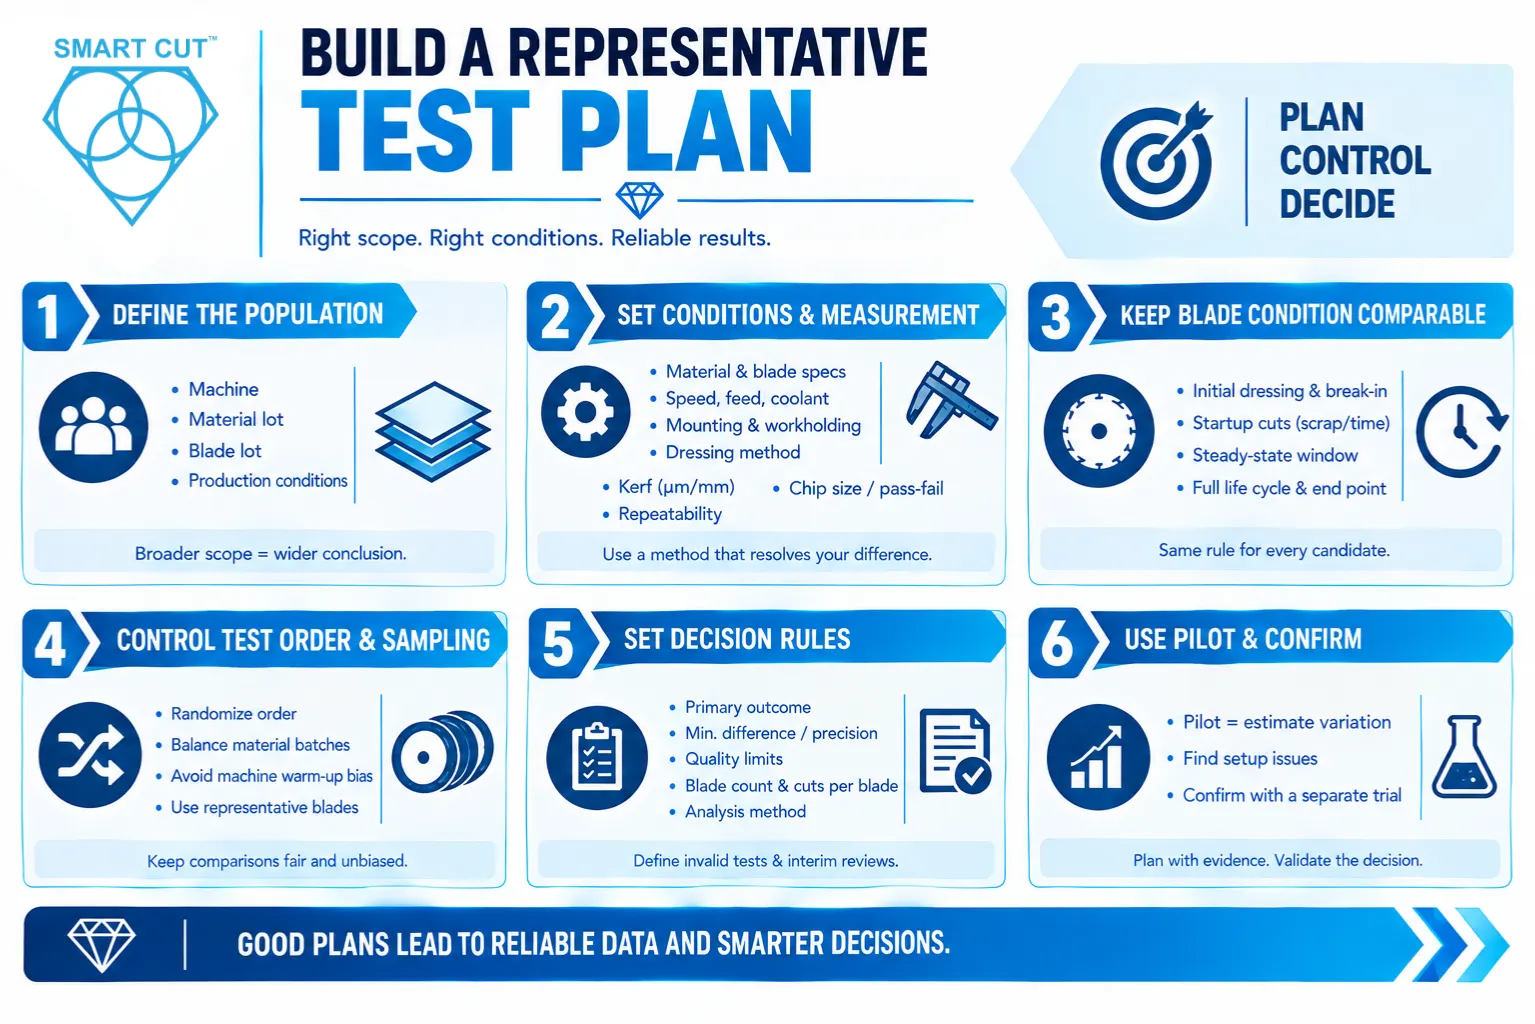
Define the population your conclusion will cover. Results from one machine, one material lot, and one blade lot support a narrower conclusion than results covering the intended production conditions. Tighter control helps isolate differences, but production approval also requires relevant operating variation.
Set the conditions and measurement method
Document the material grade, dimensions, orientation, cut depth, blade specification, spindle speed, feed method, mounting, workholding, coolant, and dressing procedure. Verify the machine condition and use a measurement method capable of resolving the difference you care about.
For precision work, record kerf in micrometers or millimeters with defined measurement locations. For edge quality, define whether you record maximum chip size, an average, or a pass or fail result. Repeated readings of the same cut characterize measurement repeatability. They do not create new cutting samples.
Keep blade condition comparable
Specify how initial dressing and break-in are handled. Record startup cuts and their scrap or time costs. If the objective is steady-state cutting, define a separate measurement window after the prescribed conditioning sequence. Apply that rule consistently to every candidate.
For life testing, include the full agreed service cycle. Define end of life before starting, such as reaching a wear limit, exceeding a quality limit, or losing the ability to maintain the required cut under the specified conditions. Record dressing events and downtime.
A short early-life trial cannot establish total blade life. If a blade remains usable when a scheduled trial ends, record its life as at least the accumulated cutting amount. Do not treat the stopping point as its measured failure life.
Control test order and sampling
Randomize candidate order where practical. Balance candidates within relevant material batches or test days. Running every sample of one specification first can confuse blade performance with machine warming, coolant changes, or material drift.
Select blades to represent the specification and lots your decision covers. Avoid choosing only unusually good-looking samples. If each candidate needs different optimized settings, describe the comparison as blade-and-process performance and document both settings.
Set the decision rules before testing
Write down the primary outcome, minimum worthwhile difference or required precision, quality limits, planned blade count, cuts per blade, and analysis method. Define invalid-test rules and any interim reviews. A staged design should specify how repeated reviews will be handled statistically.
When historical data are unavailable, use a pilot to estimate variability and identify setup problems. Treat that pilot as planning evidence. A separate confirmatory trial is often the clearest way to evaluate a plan developed after examining preliminary results.
Estimate the number of blades for an average
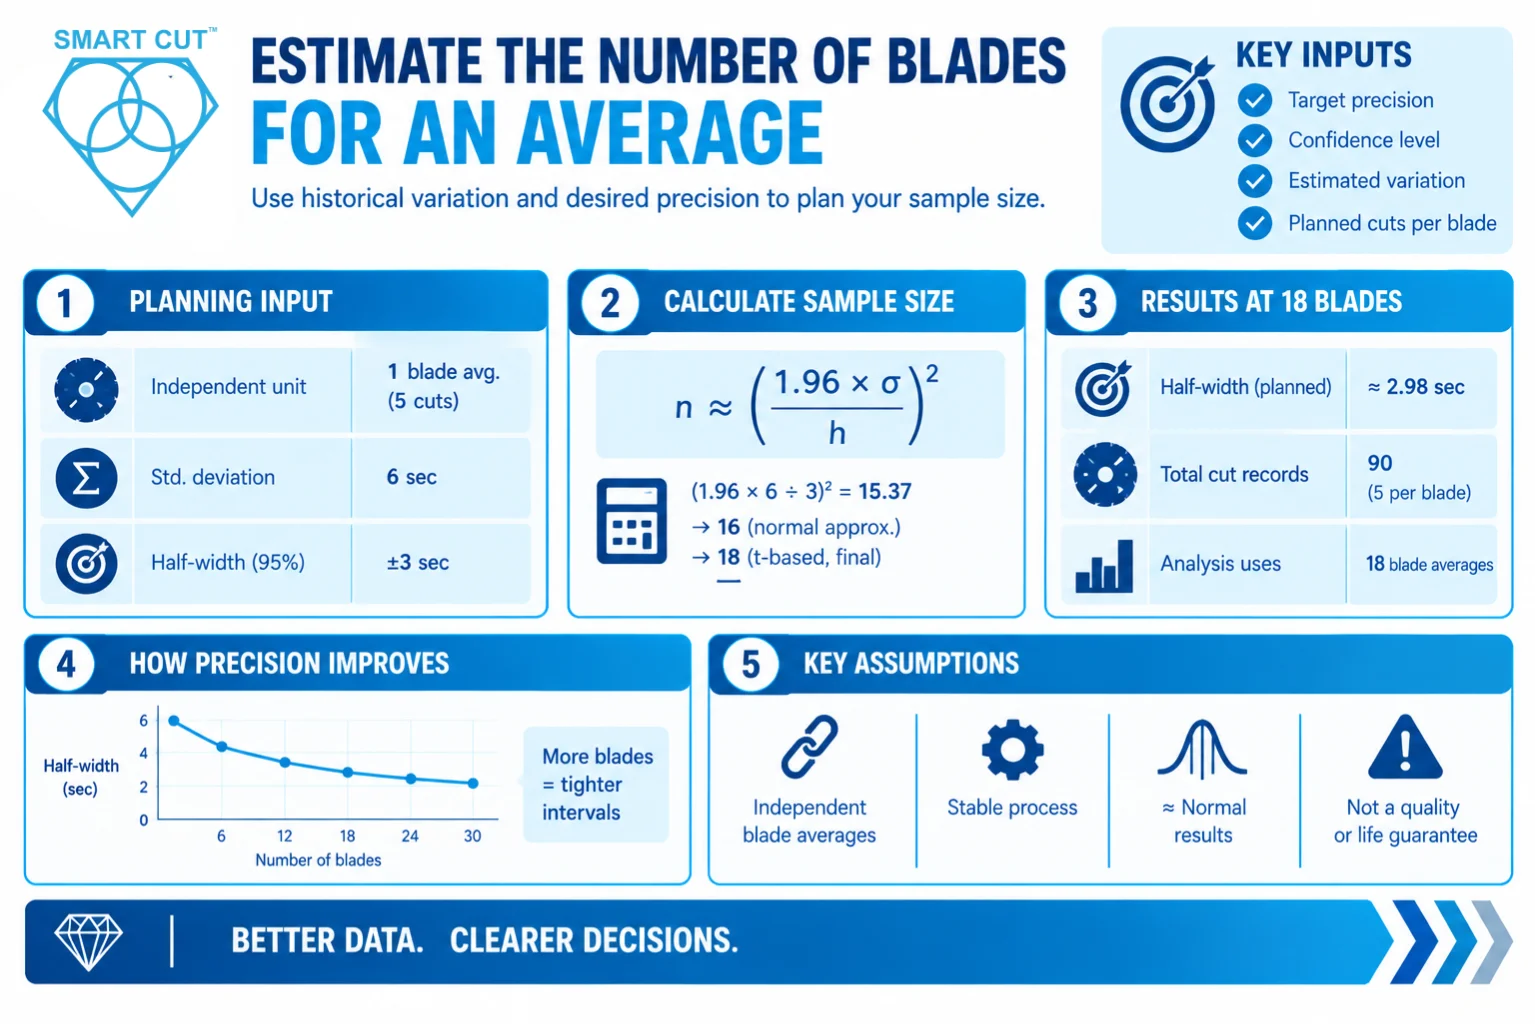
Suppose you want to estimate average cutting time during a defined early-life window. You plan five scheduled cuts per blade and calculate one average for each blade. Historical data from comparable trials suggest a standard deviation of 6 seconds among those blade averages. You want a 95% confidence interval with a half-width of 3 seconds.
| Planning input | Illustrative value |
|---|---|
| Independent sample unit | One blade average from five scheduled cuts |
| Estimated standard deviation of blade averages | 6 seconds |
| Required precision for the overall mean | ±3 seconds at 95% confidence |
A normal approximation gives an initial sample estimate:
Number of blades ≈ (1.96 × standard deviation ÷ allowed half-width)²
Using the example values, (1.96 × 6 ÷ 3)² = 15.37. Rounding up gives 16 blades. Because the standard deviation is estimated, a t-based calculation is more appropriate for the final plan. Holding the estimated variation at 6 seconds, that calculation gives 18 blades.
At 18 blades, the planned half-width is approximately 2.11 × 6 ÷ √18 = 2.98 seconds. Five scheduled cuts on each blade produce 90 cut records, but the analysis uses 18 independent blade averages.
This calculation assumes independent, representative blade averages and a stable process with approximately normal blade-level results. It does not establish acceptable chipping, yield, or total blade life. At the planned review, calculate the interval from the actual data. If it is too wide, report that the precision target was not met and plan any additional study explicitly.
Compare specifications against a useful difference
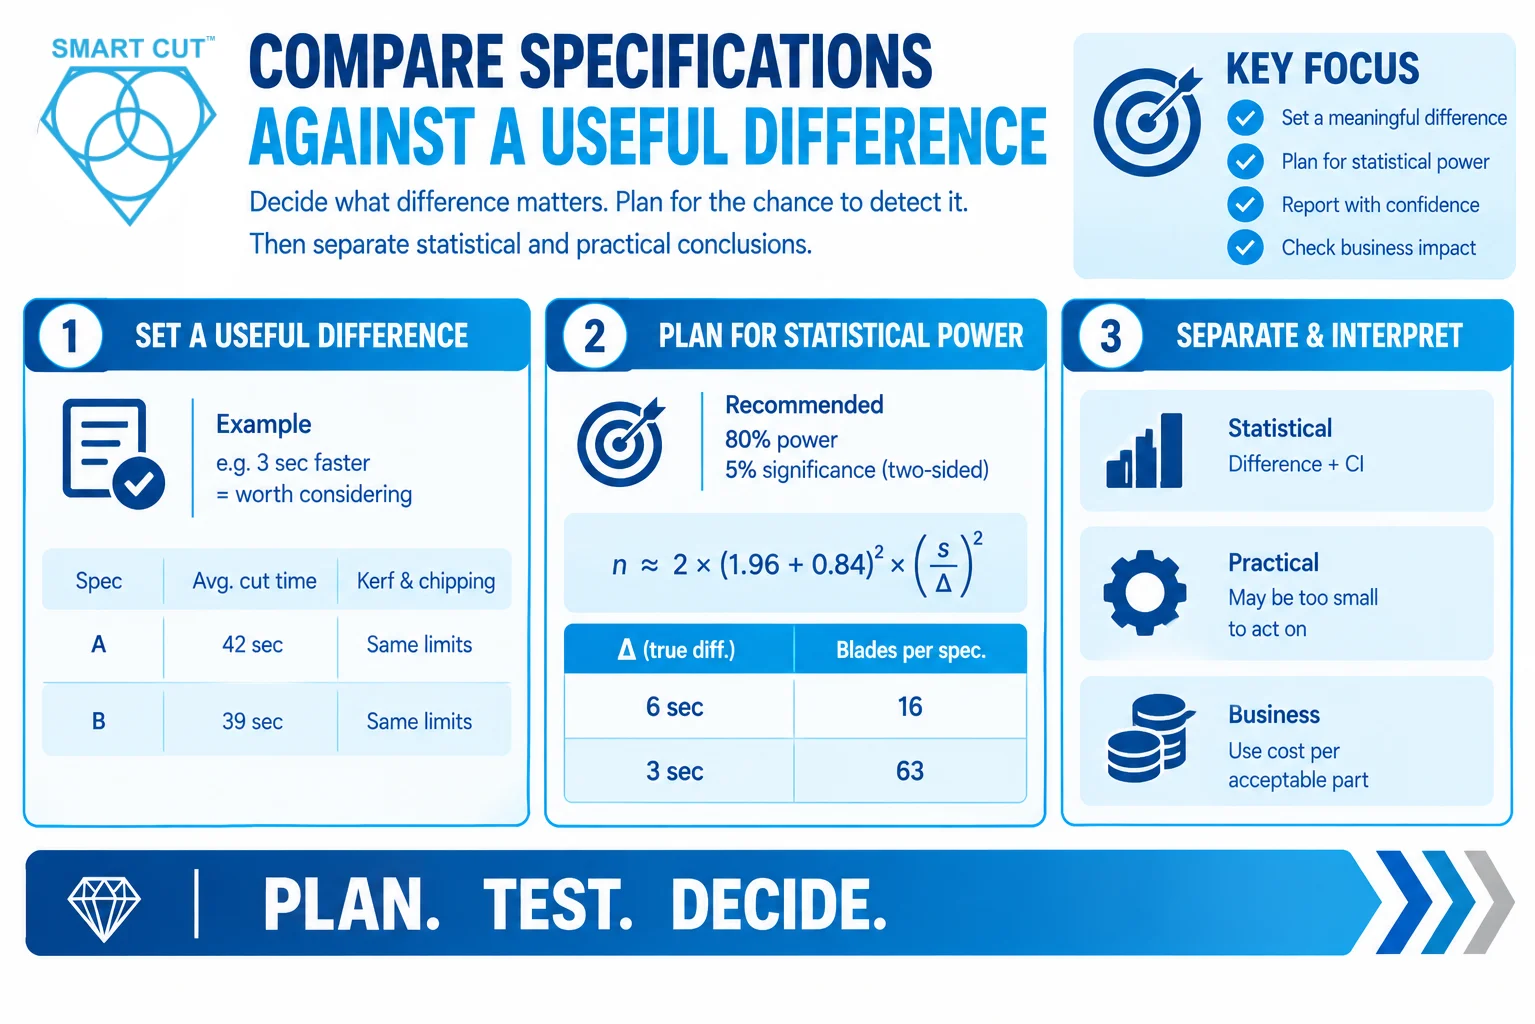
A comparison asks whether one specification performs differently and whether the improvement matters. Define the smallest difference worth acting on before you start. For example, a 3-second reduction in cutting time might justify considering a change while maintaining the same kerf and chipping limits.
The difference between averages does not need to exceed the standard deviation of individual observations to be detectable. The relevant uncertainty is the uncertainty in the estimated difference. It depends on both groups, their sample sizes, and the study design.
Plan for the chance of detecting an improvement
Statistical power is the probability that the planned test will detect a specified true difference under its assumptions. A common planning choice is 80% power with a two-sided 5% significance level. These choices should reflect the decision risk and any required qualification procedure.
For two equally sized independent groups with similar variability, an approximate sample size per specification is 2 × (1.96 + 0.84)² × (s ÷ Δ)². Here, s is the standard deviation of the independent blade-level results and Δ is the difference you want to detect.
| Illustrative planning case | True difference to detect | Approximate blades per specification |
|---|---|---|
| Standard deviation of 6 seconds | 6 seconds | 16 |
| Standard deviation of 6 seconds | 3 seconds | 63 |
These estimates give approximately 80% power to detect a difference from zero when the true difference is the stated amount. They do not give 80% power to prove that an improvement exceeds that amount. If approval requires evidence of a gain above a minimum threshold, plan the test against that threshold and specify the larger improvement you expect.
These rounded normal-approximation estimates may increase with a t-based power calculation. Paired trials, unequal variability, repeated cuts, skewed life data, and pass or fail outcomes need suitable calculations. The earlier 18-blade example estimates one mean and does not determine the sample size for this comparison.
Separate statistical and practical conclusions
Report the estimated difference and its confidence interval. A statistically detectable difference can be too small to justify a change. Conversely, an observed improvement that looks commercially attractive can remain too uncertain to support a firm conclusion.
If the test does not detect a difference, describe the result as inconclusive unless the study specifically supports equivalence. Demonstrating practical equivalence requires a predefined acceptable difference and an appropriate equivalence analysis. “No significant difference” is not proof that two blades perform the same.
Evaluate the business outcome using acceptable output. A useful cost measure divides the relevant blade, processing, dressing, downtime, and scrap costs by the number of acceptable parts or cuts. Keep the cost basis and quality requirements consistent across candidates.
Stop according to the plan
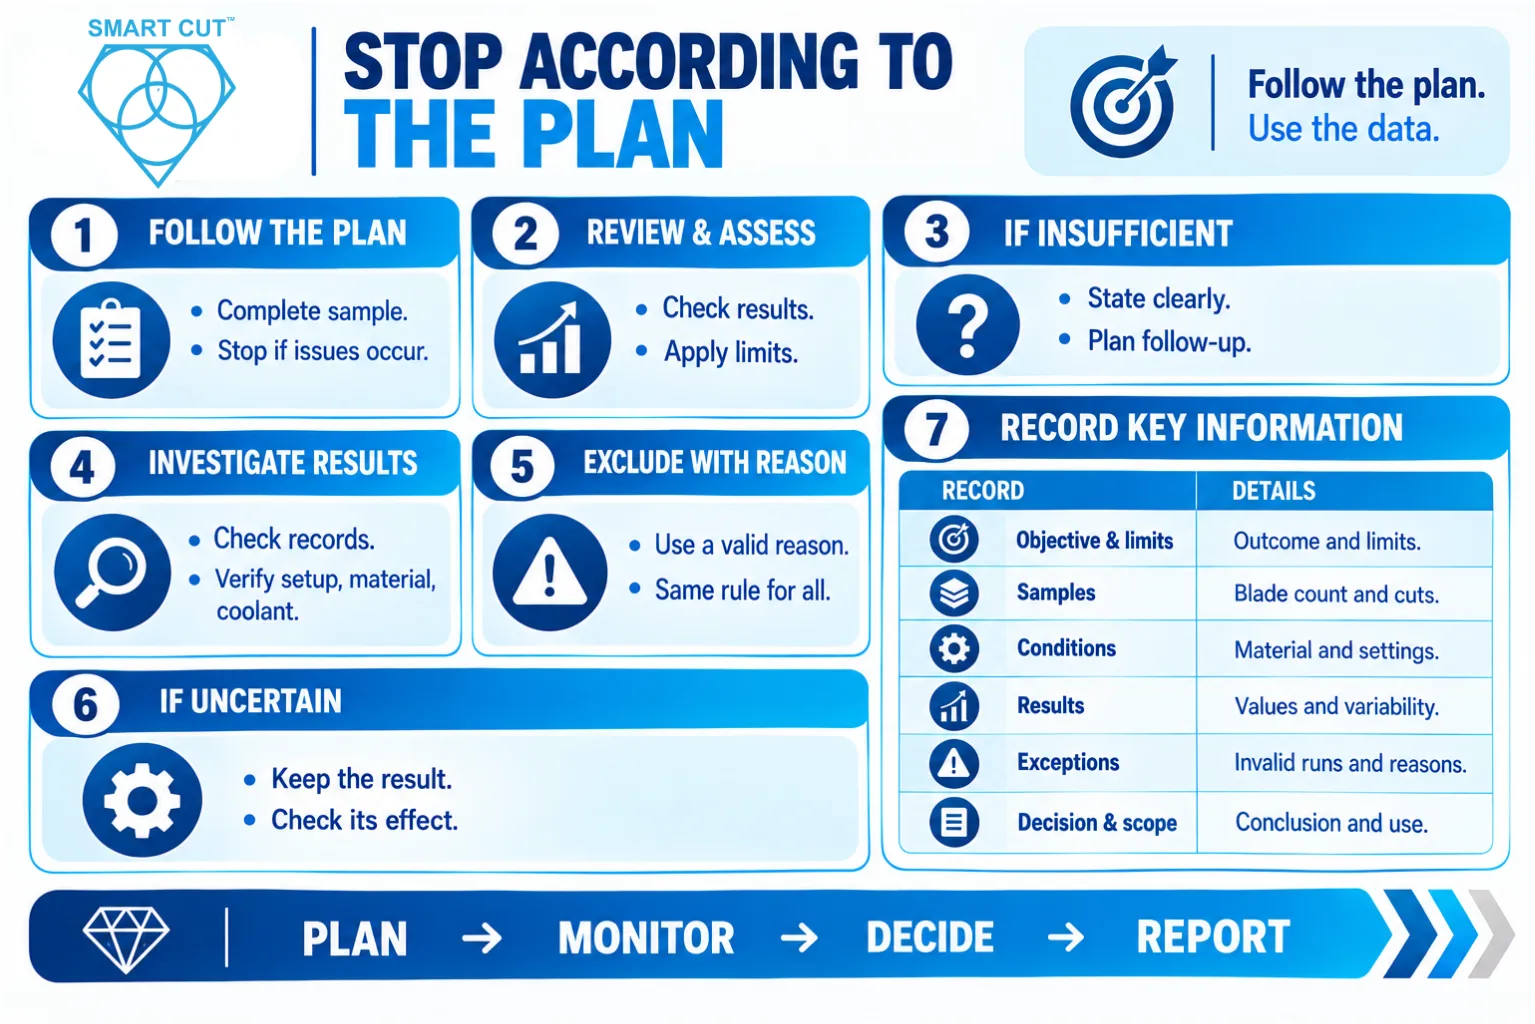
Complete the planned sample unless a predefined stopping condition applies. Stop and investigate an equipment problem, an invalid setup, or unacceptable cutting behavior when it occurs. Statistical planning does not require you to continue an unsuitable trial.
At the scheduled review, assess the agreed outcome. For an estimation study, report whether the confidence interval meets the precision target. For a comparison, assess the effect and its uncertainty against the useful difference and quality limits. For production qualification, apply the agreed acceptance procedure.
If the evidence is insufficient, state that clearly. Decide whether a separately planned follow-up is worth its cost. Do not repeatedly add a few cuts and rerun an ordinary significance test until a preferred answer appears. Formal sequential methods can support staged decisions when their stopping rules and analysis are designed together.
Investigate unusual results without discarding inconvenient data
Preserve the original record. Check measurement entry, mounting, material condition, coolant delivery, and machine events. Exclude an observation only when a documented reason makes it invalid for the defined evaluation. Apply the same rule to every candidate.
An identifiable cause is not automatic permission to exclude a result. A setup error outside the procedure may invalidate a trial. A recurring interruption under normal production conditions may belong in the performance assessment. A blade failure relevant to the application must remain part of the evidence.
When the cause is uncertain, retain the result and examine how it affects the conclusion. If an interruption changes the condition of the blade, determine whether later cuts still meet the protocol. Removing one record does not restore the blade to its earlier condition.
Report enough information for someone else to assess the result
| Record | Minimum useful detail |
|---|---|
| Objective and limits | Primary outcome, useful difference or precision target, quality limits |
| Samples | Blade count, cuts per blade, relevant lots, and selection method |
| Conditions | Material, geometry, machine settings, mounting, coolant, and dressing |
| Results | Units, individual blade results, variability, and confidence intervals |
| Exceptions | Invalid trials, failures, interruptions, exclusions, and reasons |
| Decision and scope | Supported conclusion, unmet criteria, and applicable conditions |
For small datasets, show the individual blade results alongside the summary. Keep all cut records available. This makes unusually strong or weak samples visible and helps distinguish repeatability problems from a consistent difference between specifications.
Frequently Asked Questions
They can provide useful screening or pilot information. They may also support a narrow conclusion under a justified protocol. The count alone does not establish adequate precision, statistical power, or production suitability.
They can characterize that blade within the tested conditions. They cannot establish variation across a blade specification. Report the number of blades and the repeated cuts separately.
No. A running average becomes less responsive as data accumulate. Evaluate uncertainty and the predefined decision criteria at the planned review.
A short trial measures early performance. A life claim requires suitable life testing or a separately validated predictive method. Define end of life and record any blades that remain usable when testing ends.
Use controlled, representative conditions and make the best measurements you can. Matched comparisons may improve efficiency when the design supports them. Report the wider uncertainty and limit the conclusion to what the evidence supports.
When the approval is intended to cover different machines, material lots, blade lots, operators, or operating ranges. Include the relevant conditions in the plan and analyze them appropriately. Additional cuts under one narrow condition do not establish performance everywhere.
Related reading
Evaluating and Comparing Diamond Blades covers test conditions and performance measurements.
Why the Same Diamond Blade Performs Differently explains machine, material, and application effects.
Total Cost of Ownership for Diamond Tools examines the costs behind a blade selection decision.
Plan your next blade evaluation
Before your next trial, identify the material, sample dimensions, current blade, machine, operating conditions, and acceptance limits. Decide whether you need a screening result, a performance estimate, a comparison, or production qualification.
For help defining a practical diamond or CBN blade evaluation, request applications engineering assistance from UKAM Industrial Superhard Tools.
Trusted by Tens of Thousands of Manufacturers, Laboratories,
Research Institutions Worldwide Since 1990
Established in 1990
RELATED ARTICLES

Brian is an experienced professional in the field of precision cutting tools, with over 27 years of experience in technical support. Over the years, he has helped engineers, manufacturers, researchers, and contractors find the right solutions for working with advanced and hard-to-cut materials. He’s passionate about bridging technical knowledge with real-world applications to improve efficiency and accuracy.
As an author, Brian Farberov writes extensively on diamond tool design, application engineering, return on investment strategies, and process optimization, combining technical depth with a strong understanding of customer needs and market dynamics.
About Brian Farberov
Brian is an experienced professional in the field of precision cutting tools, with over 27 years of experience in technical support. Over the years, he has helped engineers, manufacturers, researchers, and contractors find the right solutions for working with advanced and hard-to-cut materials. He’s passionate about bridging technical knowledge with real-world applications to improve efficiency and accuracy. As an author, Brian Farberov writes extensively on diamond tool design, application engineering, return on investment strategies, and process optimization, combining technical depth with a strong understanding of customer needs and market dynamics.
View all posts by Brian Farberov