


















Diamond Grinding Wheel Performance: How Engineers Measure Tool Life, Cycle Time, and Cost Per Part

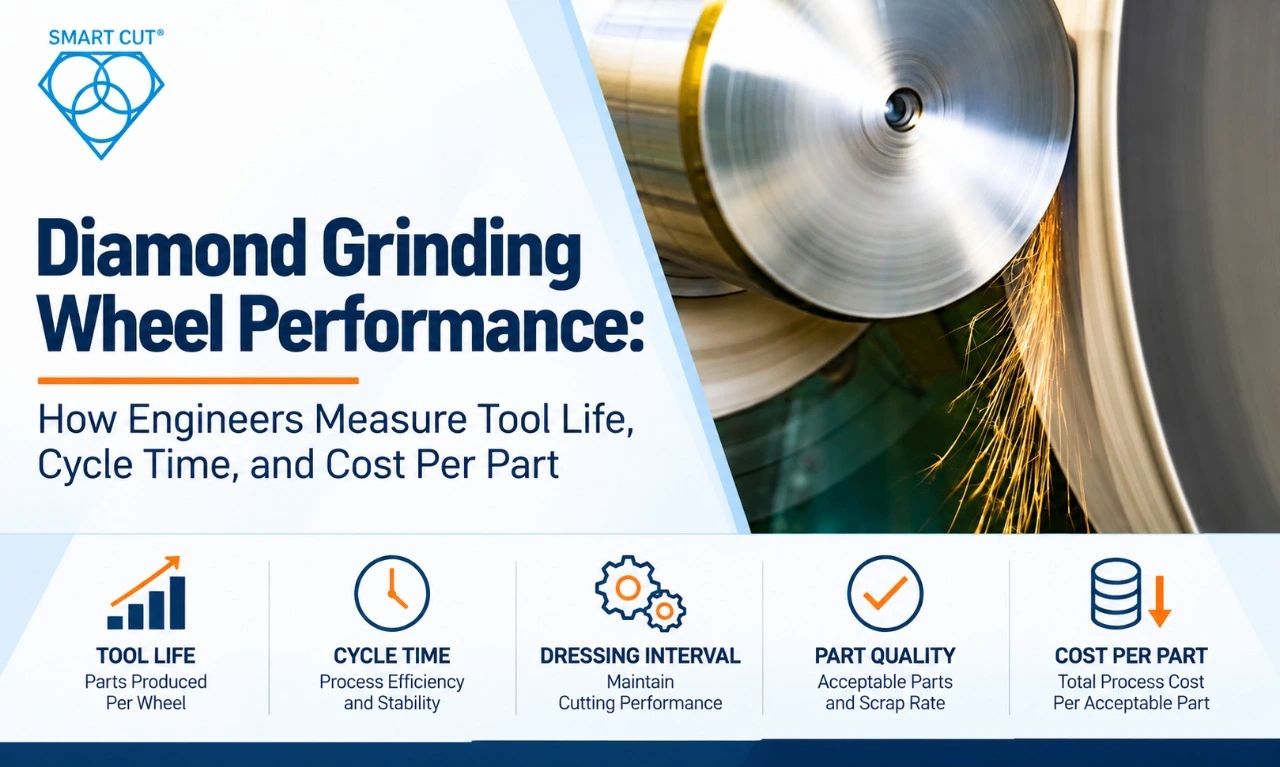
Table of Contents
Toggle
American Based Manufacturer

Established in 1990


Custom manufacturing


A diamond grinding wheel should not be judged only by how long it physically remains on the machine.
For production grinding, the more useful question is:
How much acceptable production does the wheel deliver before its performance falls outside the process limits?
A wheel can continue cutting while producing unacceptable surface finish, dimensional drift, edge damage, excessive grinding force, thermal damage, or longer cycle times. Conversely, a wheel with a higher purchase price can produce a lower cost per acceptable part if it delivers longer usable life, fewer dressing operations, lower scrap, and more stable cycle times.
This makes diamond grinding wheel performance a process measurement problem rather than a simple tool purchasing decision.
Engineers evaluating wheel performance should track at least five linked variables:
- Parts produced per wheel
- Dressing or conditioning interval
- Cycle time
- Part quality and scrap
- Cost per acceptable part
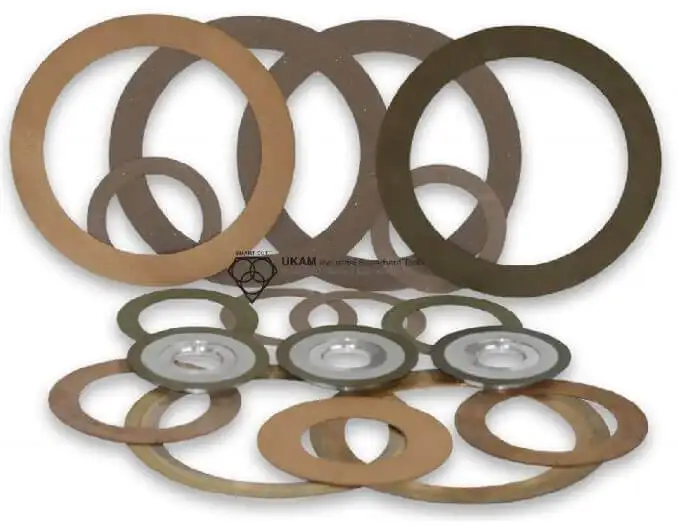
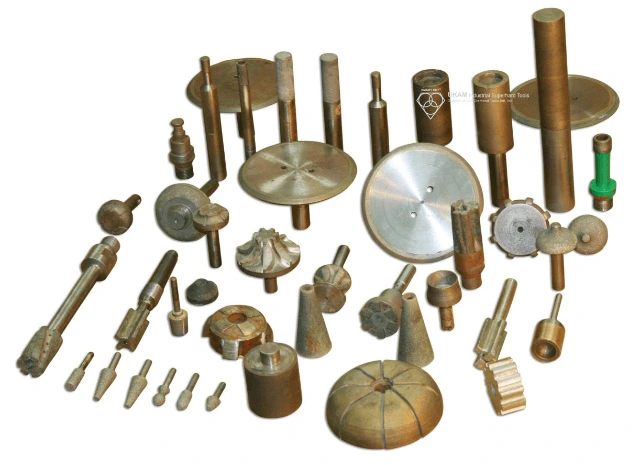
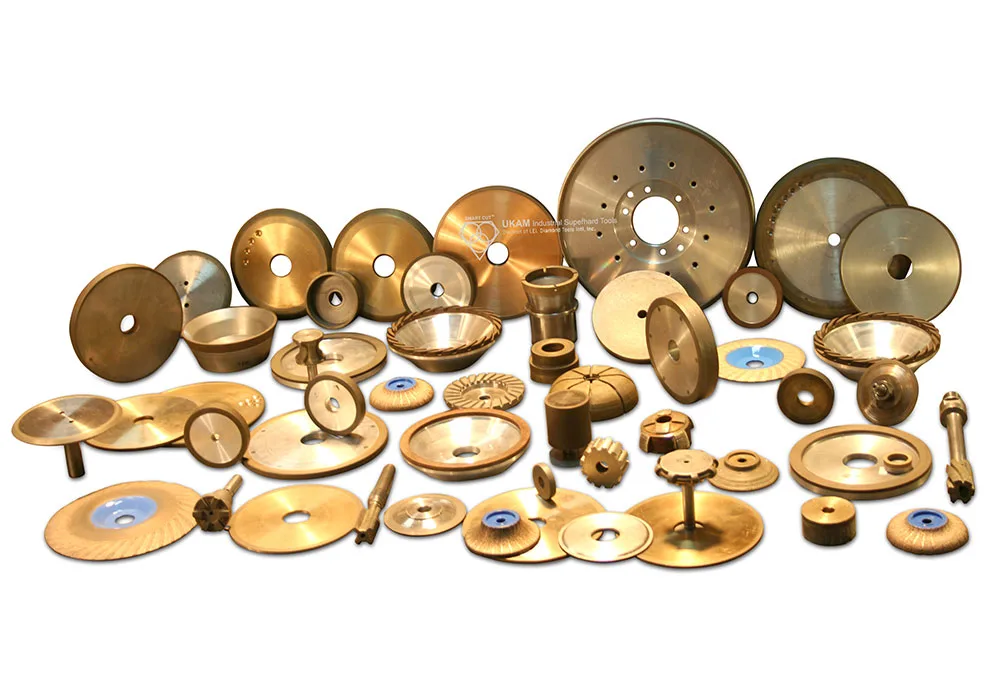
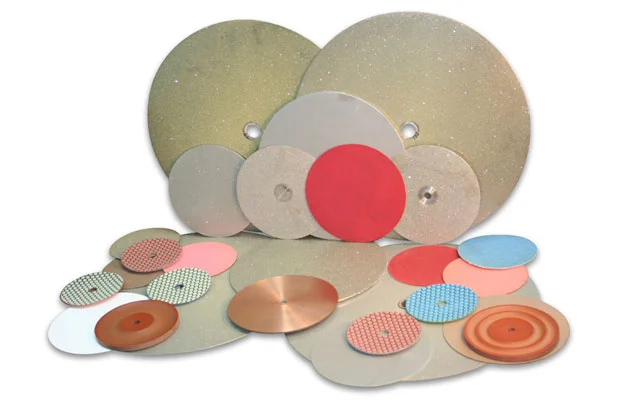
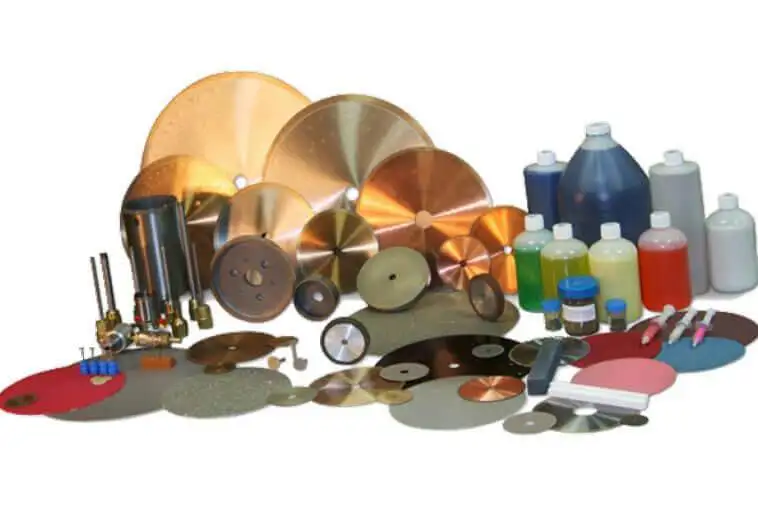
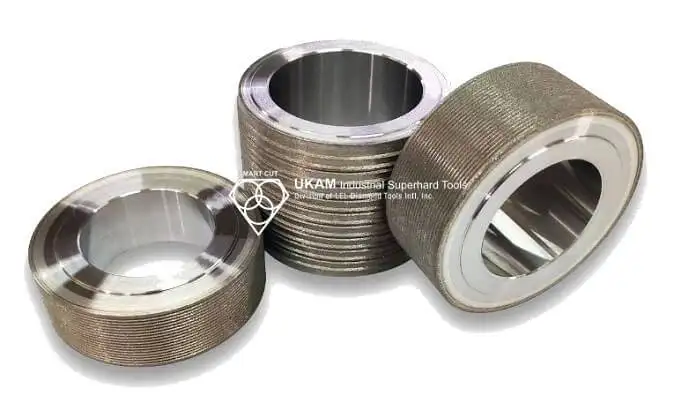
UKAM manufactures diamond and CBN grinding wheels in multiple bond technologies and also provides custom manufacturing for application-specific requirements. Its published capabilities include sintered metal bond, resin bond, hybrid, electroplated, brazed, and vitrified technologies.
The purpose of this article is not to identify one universally superior wheel. It is to show how manufacturing engineers can measure wheel performance and determine whether a wheel specification is actually improving the production process.
Start With a Production Baseline
Before comparing two diamond grinding wheels, document the current process.
Without a baseline, a wheel trial can easily become a subjective comparison based on operator comments such as:
- “The wheel feels sharper.”
- “It seems to last longer.”
- “The finish looks better.”
- “We are dressing less often.”
Those observations can be useful, but they are not enough to release a wheel for production.
A baseline should capture the machine, wheel, process conditions, quality requirements, and economic result.
Diamond Grinding Wheel Performance Baseline
|
Parameter |
Baseline Measurement |
|---|---|
|
Workpiece material |
Exact grade/specification |
|
Grinding operation |
OD, ID, surface, profile, form, etc. |
|
Diameter, width, grit, concentration, bond, hardness |
|
|
Grinder model and spindle capability |
|
|
RPM or surface speed |
|
|
Feed |
Table/feed rate |
|
Depth of cut |
mm/pass or equivalent |
|
Type, concentration, flow and delivery |
|
|
Cycle time |
Minutes per acceptable part |
|
Dressing interval |
Parts or cycles between dressing |
|
Wheel life |
Acceptable parts per wheel |
|
Surface finish |
Ra/Rz or specified requirement |
|
Dimensional result |
Actual tolerance data |
|
Scrap/rework |
Percentage or parts rejected |
|
Tool cost |
Purchase cost per wheel |
|
Cost per acceptable part |
Calculated production metric |
This baseline becomes the reference against which a new wheel is evaluated.
What Does “Tool Life” Actually Mean?
One of the most common mistakes in wheel evaluation is defining tool life as the point at which the wheel stops cutting.
That is rarely the correct production definition.
A diamond wheel may still remove material after its cutting behavior has changed significantly. The wheel may produce higher forces, generate more heat, require more dressing, or produce parts outside dimensional or surface-finish limits.
For production engineering, usable tool life should normally be tied to an acceptance criterion.
A practical definition is:
Usable wheel life = the number of acceptable parts produced before the wheel requires replacement, reconditioning, or a process intervention that exceeds the defined production limit.
|
Failure Endpoint |
What It Indicates |
|---|---|
|
Surface finish exceeds specification |
Cutting condition has degraded |
|
Dimensional drift exceeds tolerance |
Wheel form or cutting behavior has changed |
|
Grinding force increases beyond limit |
Wheel loading, dulling or bond behavior may be changing |
|
Process energy or coolant effectiveness is no longer acceptable |
|
|
Dressing frequency becomes excessive |
Wheel structure is no longer economically stable |
|
Profile loss exceeds tolerance |
Wheel geometry cannot be maintained |
|
Scrap rate increases |
Wheel performance is affecting part quality |
|
Cycle time increases beyond target |
Productivity has degraded |
|
Wheel cannot maintain required geometry |
Functional wheel life has ended |
This distinction changes the way wheel life is measured.
A wheel that produces 3,000 parts but only 2,700 acceptable parts does not have a production life of 3,000 acceptable parts.
Measure Acceptable Parts, Not Just Parts Processed
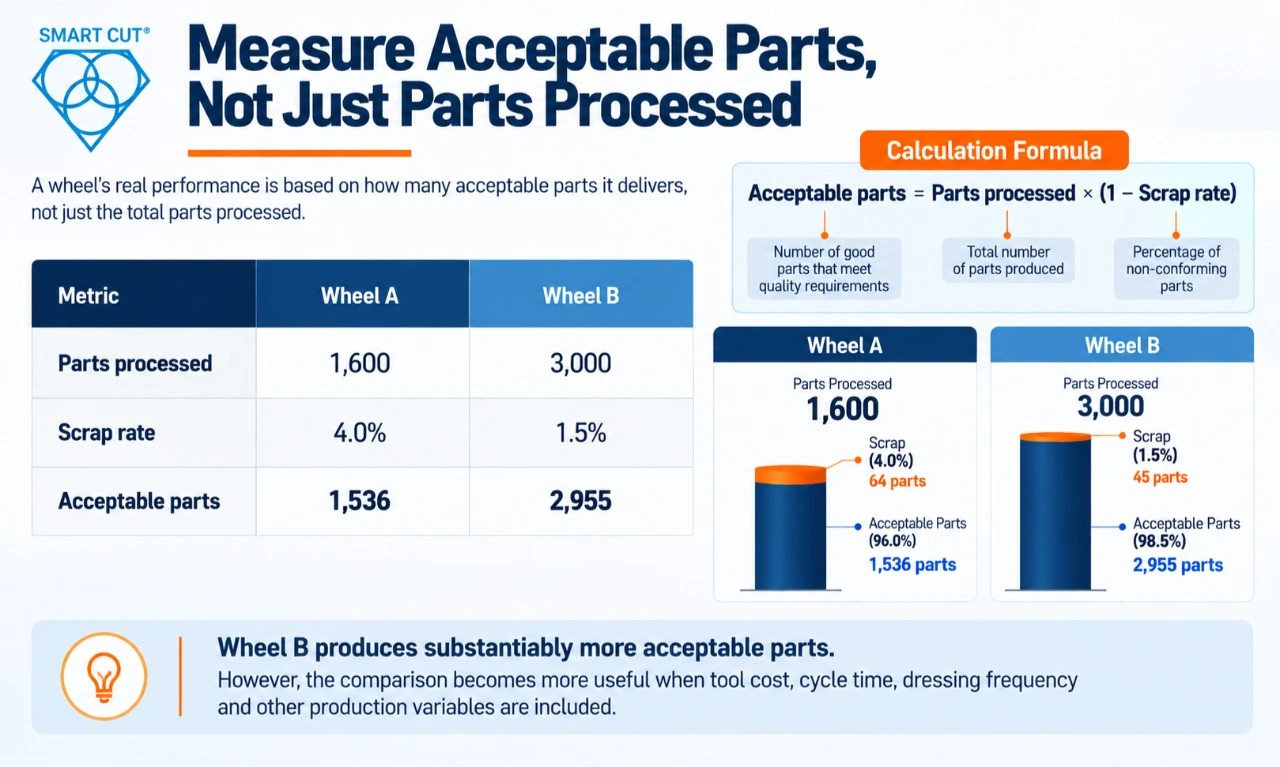
Suppose two wheels are tested under controlled production conditions.
|
Metric |
Wheel A |
Wheel B |
|---|---|---|
|
Parts processed |
1,600 |
3,000 |
|
Scrap rate |
4.0% |
1.5% |
|
Acceptable parts |
1,536 |
2,955 |
Wheel B produces substantially more acceptable parts.
However, the comparison becomes more useful when tool cost, cycle time, dressing frequency and other production variables are included.
The basic calculation is:
Acceptable parts = Parts processed × (1 − Scrap rate)
This should be the foundation of the economic comparison.
Cost Per Acceptable Part Is More Useful Than Wheel Price
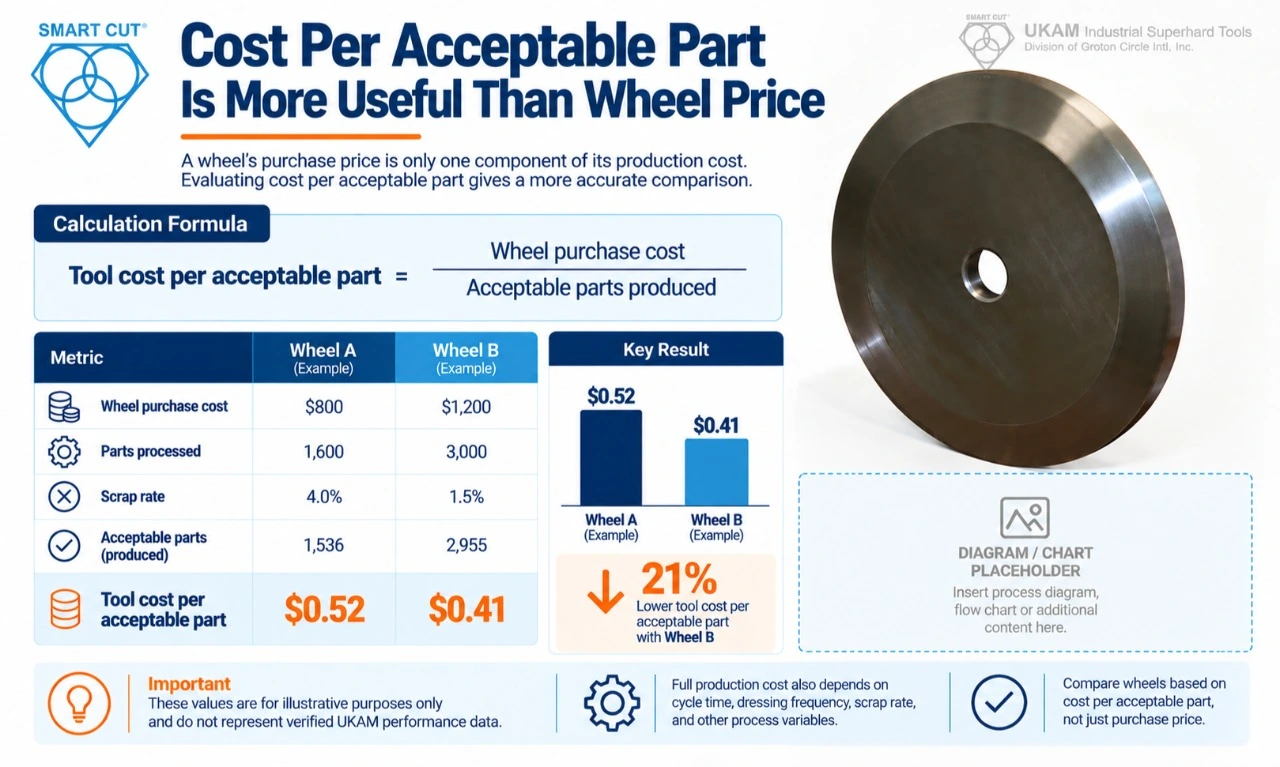
A wheel’s purchase price is only one component of its production cost.
A useful first-level calculation is:
Tool cost per acceptable part = Wheel purchase cost ÷ Acceptable parts produced
Consider an illustrative comparison:
|
Metric |
Current Wheel |
Trial Wheel |
|---|---|---|
|
Wheel cost |
$480 |
$720 |
|
Parts processed |
1,600 |
3,000 |
|
Scrap rate |
4.0% |
1.5% |
|
Acceptable parts |
1,536 |
2,955 |
|
Tool cost per acceptable part |
$0.3125 |
$0.2437 |
These figures are illustrative only and are not UKAM pricing or guaranteed performance.
The trial wheel costs 50% more to purchase, yet its calculated tool cost per acceptable part is lower because it produces more acceptable parts.
The full production calculation should go further.
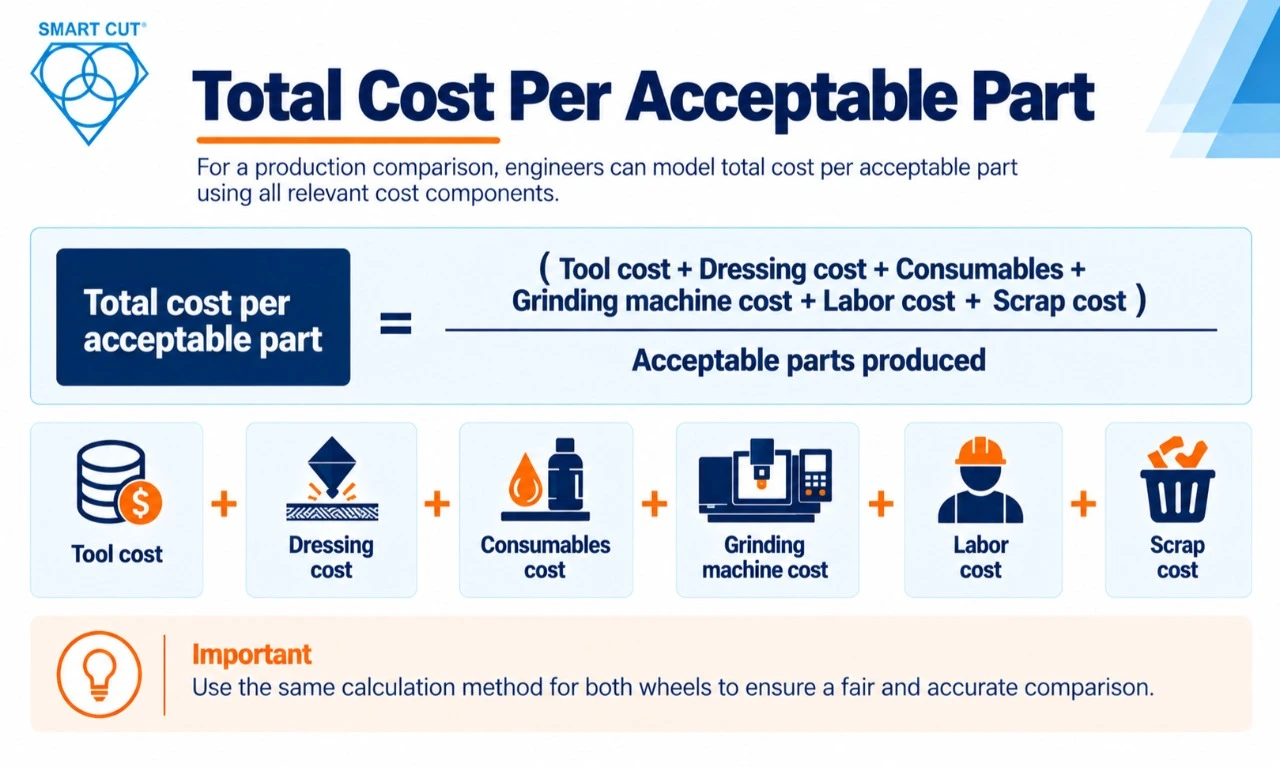
For a production comparison, engineers can model:
Total cost per acceptable part =
(Tool cost + Dressing cost + Consumables + Grinding machine cost + Labor cost + Scrap cost) ÷ Acceptable parts
Not every process needs every cost component. The important point is to define the calculation before the trial so both wheels are measured using the same method.
Cycle Time Can Change the Economic Result
Wheel life alone does not determine production performance.
A wheel that lasts longer but requires a slower grinding cycle may not produce the lowest cost per part.
For example:
|
Metric |
Wheel A |
Wheel B |
|---|---|---|
|
Wheel life |
1,600 parts |
3,000 parts |
|
Cycle time |
5.0 min |
4.2 min |
|
Scrap |
4.0% |
1.5% |
|
Dressing interval |
200 parts |
500 parts |
Wheel B has advantages in all four measurements in this illustrative example.
But engineers should not assume that changing wheels automatically produces these improvements. They must be demonstrated under controlled process conditions.
The trial should therefore record:
- Cycle time
- Actual feed
- Depth of cut
- Wheel speed
- Dressing time
- Loading/unloading time
- Inspection time
- Rework
- Scrap
- Downtime
This prevents a wheel from appearing economical simply because one production variable was excluded.
Dressing Frequency Is a Production KPI
Dressing is not just a maintenance activity.
Every dressing operation can consume:
- Machine time
- Operator time
- Wheel material
- Diamond dresser life
- Coolant
- Setup time
- Production capacity
If a wheel requires dressing every 100 parts while another remains stable for 500 parts, the difference can become significant over a production run.
|
Metric |
Wheel A |
Wheel B |
|---|---|---|
|
Parts between dressing |
200 |
500 |
|
Production quantity |
10,000 |
10,000 |
|
Approx. dressing events |
50 |
20 |
|
Relative dressing frequency |
Higher |
Lower |
The actual economic benefit depends on dressing time, dressing method, wheel condition and production requirements.
The important engineering principle is:
Measure dressing events against acceptable production output, not simply against elapsed time.
Build a Diamond Grinding Wheel Performance Dashboard
A production trial becomes much easier to interpret when the key variables are placed on one scorecard.
|
KPI |
Baseline |
Trial |
Target |
Decision |
|---|---|---|---|---|
|
Parts per wheel |
1,500 |
2,400 |
≥2,200 |
Pass |
|
Dressing interval |
200 |
500 |
≥400 |
Pass |
|
Cycle time |
5.0 min |
4.2 min |
≤4.5 min |
Pass |
|
Surface finish Ra |
0.32 µm |
0.21 µm |
≤0.25 µm |
Pass |
|
Scrap rate |
4.0% |
1.4% |
≤2.0% |
Pass |
|
Cost/acceptable part |
$0.31 |
$0.24 |
≤$0.26 |
Pass |
These values are illustrative.
The dashboard becomes useful because it connects tool behavior to the actual production decision.
A wheel should not be declared successful simply because it wins one category.
For example:
- Longer wheel life but unacceptable surface finish = fail
- Better surface finish but excessive cycle time = potentially fail
- Lower wheel cost but higher scrap = potentially fail
- Longer life with lower dressing frequency and stable quality = stronger production case
This is the level at which wheel evaluation becomes meaningful.
Measure Wheel Wear Instead of Guessing It
Visual inspection alone is often insufficient.
Depending on the grinding operation, engineers can measure:
- Wheel diameter before and after testing
- Wheel width
- Profile geometry
- Grinding wheel runout
- Diamond layer condition
- Dressing stock
- Number of dressing operations
- Material removed per dressing cycle
For profile grinding, form retention can be more important than total wheel diameter loss.
A wheel that maintains diameter but loses the required profile may already be unsuitable for production.
|
Measurement |
Initial |
After Trial |
Change |
|---|---|---|---|
|
Outside diameter |
150.00 mm |
148.90 mm |
1.10 mm |
|
Wheel width |
10.00 mm |
9.82 mm |
0.18 mm |
|
Profile radius |
2.000 mm |
1.982 mm |
0.018 mm |
|
Runout |
5 µm |
7 µm |
+2 µm |
The actual acceptance limits must come from the application.
Grinding Force Can Reveal Performance Changes Before Quality Fails
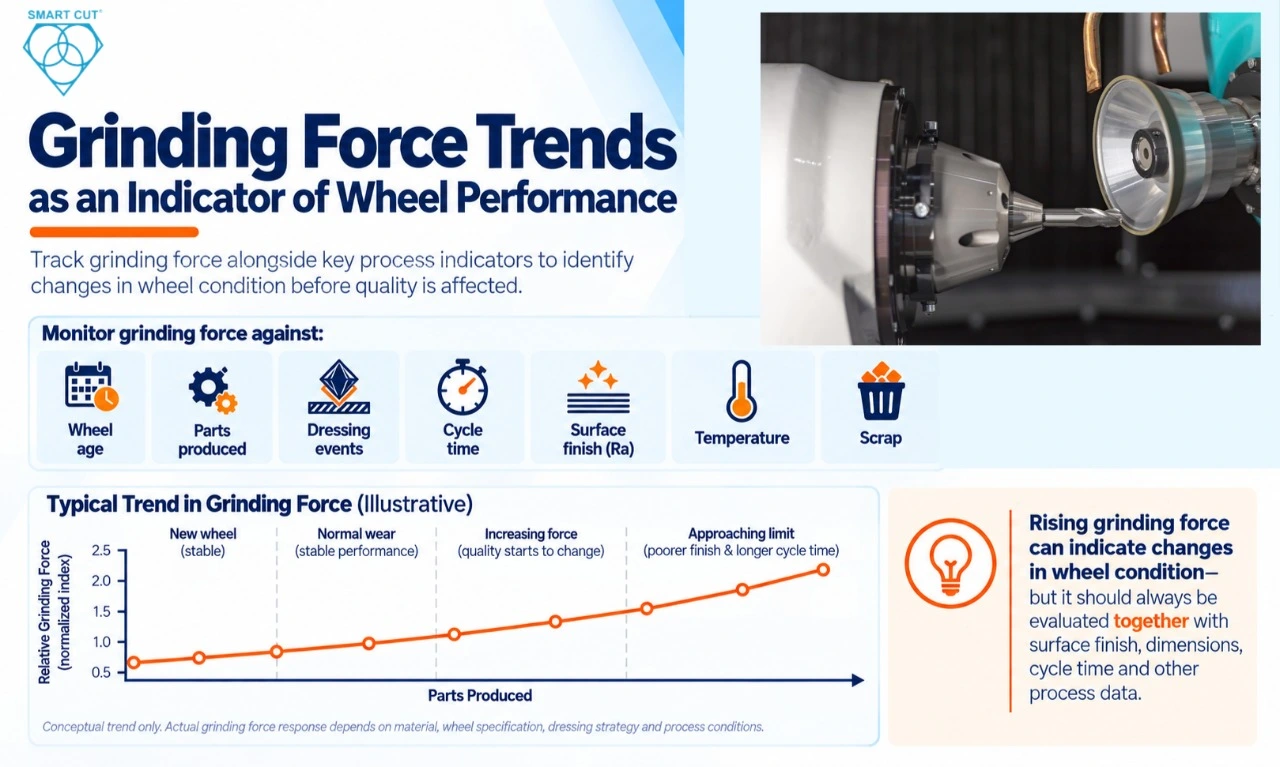
Grinding force is another useful diagnostic measurement.
As the abrasive system becomes loaded, dull, glazed or otherwise less effective, the process may require greater force to maintain the same material-removal condition.
If force data is available, track it against:
- Wheel age
- Parts produced
- Dressing events
- Cycle time
- Surface finish
- Temperature
- Scrap
A useful trend is not simply the absolute force value.
The trend may be more informative.
For example:
Parts produced → grinding force → surface finish → dimensional result
If force rises progressively while surface finish and cycle time also deteriorate, the wheel may be approaching its useful production limit.
Force data should be interpreted together with the rest of the process rather than treated as a standalone pass/fail measurement.
Surface Finish Should Be Tracked Across Wheel Life
A wheel can produce acceptable finish at the beginning of a run and unacceptable finish near the end.
Testing only the first few parts can therefore produce a misleading result.
Record surface finish at defined intervals.
|
Production Point |
Parts |
Ra |
|---|---|---|
|
Start |
0 |
0.20 µm |
|
Early |
250 |
0.21 µm |
|
Mid-life |
500 |
0.23 µm |
|
Late-life |
750 |
0.25 µm |
|
End |
1,000 |
0.29 µm |
If the process specification is Ra ≤ 0.25 µm, the wheel’s production life may end before the physical abrasive layer is exhausted.
This is why tool life should be connected to the part specification.
Dimensional Stability Is a Separate Performance Metric
A wheel can maintain acceptable surface finish while dimensional performance changes.
This is especially relevant to precision grinding and profile operations.
Track:
- Diameter
- Flatness
- Thickness
- Parallelism
- Profile dimensions
- Form error
- Concentricity
- Taper
Use the actual drawing tolerances wherever possible.
A production wheel should be evaluated against the finished component requirement, not against a subjective visual assessment of the wheel.
Material-Specific Failure Modes Matter
Diamond grinding wheel performance cannot be evaluated independently of the workpiece material.
Different materials can fail through different mechanisms.
A common concern is subsurface cracking or brittle fracture.
A process can appear productive while generating damage below the finished surface.
Track:
- Surface finish
- Edge condition
- Subsurface damage where required
- Grinding force
- Wheel wear
- Crack depth if the application requires destructive or microscopic evaluation
A key failure mode is edge breakout and grain pullout.
Monitor:
- Edge chipping
- Grain pullout
- Surface finish
- Dimensional stability
- Wheel loading
A major concern is grinding-induced microcracking.
The process should be evaluated for both material removal rate and resulting surface integrity.
A major concern is grinding-induced microcracking.
The process should be evaluated for both material removal rate and resulting surface integrity.
A major concern is edge chipping and subsurface damage.
The wheel should therefore be evaluated against both productivity and damage criteria.
Typical concerns include edge fracture, cracking and chipping.
Wheel selection and process conditions must be evaluated against the required edge quality rather than cycle time alone.
Typical concerns include edge fracture, cracking and chipping.
Wheel selection and process conditions must be evaluated against the required edge quality rather than cycle time alone.
Coolant Delivery Can Change Wheel Performance
Coolant specification alone does not describe coolant performance.
Engineers should examine:
- Coolant type
- Concentration
- Flow rate
- Nozzle position
- Delivery pressure
- Filtration
- Temperature
- Contamination
- Whether coolant actually reaches the grinding zone
A high-flow system that misses the contact zone may provide less useful cooling than a lower-flow system with better targeting.
Record coolant conditions during the wheel trial.
Otherwise, two wheel tests may appear to compare different wheels when they are actually comparing different thermal conditions.
Compare Wheels Under Controlled Conditions
A wheel comparison should change as few variables as possible.
If Wheel A is tested at one feed rate and Wheel B at another, the result does not establish whether the wheel specification caused the performance difference.
A controlled comparison should normally keep constant:
- Workpiece material and lot where practical
- Machine
- Fixture
- Wheel geometry
- Coolant
- Inspection method
- Part acceptance criteria
- Operator method
- Measurement equipment
Then define which variable is intentionally changed.
|
Variable |
Wheel A |
Wheel B |
|---|---|---|
|
Workpiece |
Same |
Same |
|
Machine |
Same |
Same |
|
Coolant |
Same |
Same |
|
Wheel diameter |
Same |
Same |
|
Wheel width |
Same |
Same |
|
Grinding parameters |
Same starting point |
Same starting point |
|
Inspection |
Same |
Same |
|
Acceptance limits |
Same |
Same |
|
Bond/specification |
Baseline |
Trial variable |
This creates a more defensible comparison.
How Different Bond Technologies Affect Performance Evaluation
There is no single bond system that should be treated as universally correct.
UKAM lists multiple diamond and CBN technologies, including sintered metal bond, resin bond, hybrid bond, electroplated, brazed and vitrified systems.
The relevant question is how the technology behaves within the specific application.
|
Technology |
Performance Characteristic to Evaluate |
|---|---|
|
Wear resistance, form retention, cutting behavior |
|
|
Surface finish, cutting action, thermal/process behavior |
|
|
Balance between cutting behavior, life and finish |
|
|
Exposed abrasive, geometry and usable abrasive layer |
|
|
Aggressive material removal and abrasive retention |
|
|
Vitrified bond |
Porosity, dressing behavior, cutting efficiency and finish |
|
Cutting consistency, dressing requirements and wheel-life behavior according to the specific application |
UKAM describes SMART CUT technology as using oriented and distributed diamond or CBN crystals within the matrix and describes an open bond design intended to support consistent cutting behavior. These are UKAM’s technology descriptions, not universal performance guarantees.
The correct engineering comparison is therefore not:
“Which bond is best?”
It is:
“Which wheel construction maintains the required production performance for this material, machine and acceptance criterion?”
When Should the Wheel Specification Be Changed?
Do not change a wheel specification simply because a new wheel looks more aggressive.
A specification change should be considered when measured evidence shows that the current wheel cannot meet the required process window economically.
- Tool life is below the production target
- Dressing frequency is excessive
- Surface finish deteriorates too quickly
- Dimensional stability cannot be maintained
- Wheel loading is persistent
- Grinding force increases beyond the process limit
- Cycle time is too high
- Scrap remains above the acceptable level
- The wheel cannot maintain the required profile
- Cost per acceptable part is higher than the production target
The next specification should then address the measured failure mechanism.
For example:
Problem: Wheel loads quickly.
Possible engineering questions:
- Is the bond too hard for the application?
- Is the abrasive specification appropriate?
- Is the dressing method correct?
- Is the coolant reaching the grinding zone?
- Is the feed too low or too high?
- Is the wheel operating outside its intended speed range?
The answer should come from process evidence rather than automatically changing grit or bond.
When Does Custom Wheel Development Make Sense?
Standard wheels are often appropriate when the application falls within a proven operating range.
Custom development becomes more interesting when the production problem is persistent and measurable.
Examples include:
- Unusual workpiece geometry
- Tight dimensional tolerances
- Difficult-to-grind materials
- Unacceptable wheel life
- Excessive dressing
- Required surface finish not consistently achieved
- High scrap caused by grinding
- Specialized mounting requirements
- Production volume large enough to justify optimization
UKAM states that it manufactures custom diamond and CBN tools according to customer requirements and considers factors including equipment, tolerances, surface finish and desired lifespan. It also states that engineers can work with customers on bond formulation, concentration and grit selection.
A custom wheel should still be evaluated using measurable production criteria.
Customization does not replace qualification.
A Five-Phase Production Wheel Evaluation
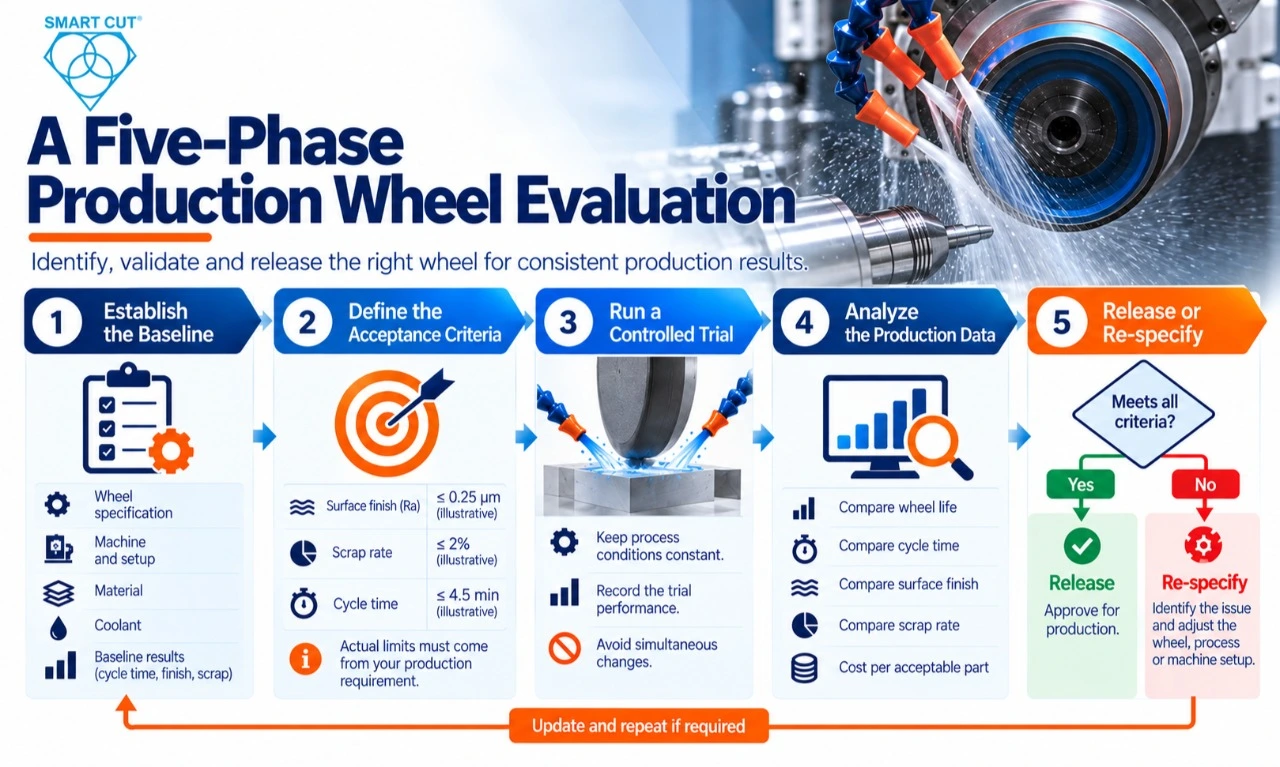
A practical wheel-performance program can be organized into five phases.
Phase 1: Establish the Baseline
Document:
- Existing wheel specification
- Machine
- Material
- Grinding parameters
- Coolant
- Cost per acceptable part
- Cycle time
- Dressing interval
- Surface finish
- Dimensional results
- Scrap
Phase 2: Define the Acceptance Criteria
Set measurable targets before testing.
For example:
- Ra ≤ 0.25 µm
- Scrap ≤ 2%
- Cycle time ≤ 4.5 minutes
- Dressing interval ≥ 400 parts
- Cost per acceptable part ≤ $0.26
The actual limits must come from the production requirement.
Phase 3: Run a Controlled Trial
Keep the process constant and record the trial wheel’s behavior.
Avoid changing multiple variables simultaneously.
Phase 4: Analyze the Production Data
Compare:
- Wheel life
- Acceptable parts
- Dressing frequency
- Cycle time
- Surface finish
- Dimensions
- Scrap
- Wheel wear
- Cost per acceptable part
Phase 5: Release or Re-specify
If the wheel meets all critical criteria, document the approved specification and process window.
If it fails, identify the failure mechanism and determine whether the wheel specification, process condition, machine condition or inspection method needs adjustment.
Production Data Should Be Logged by Part Count
Time-based observations can hide important behavior.
Instead of simply recording:
“Wheel performed well for three hours.”
record:
“Wheel produced 1,850 acceptable parts at a 4.2 minute cycle time, with dressing every 450 parts and Ra remaining below 0.25 µm.”
A production log might look like this:
|
Checkpoint |
Parts |
Cycle Time |
Ra |
Force |
Dressing |
Scrap |
|---|---|---|---|---|---|---|
|
Start |
0 |
4.2 min |
0.20 µm |
Baseline |
0 |
0% |
|
Check 1 |
400 |
4.2 min |
0.21 µm |
Stable |
1 |
0.8% |
|
Check 2 |
800 |
4.3 min |
0.22 µm |
+4% |
2 |
1.0% |
|
Check 3 |
1,200 |
4.3 min |
0.24 µm |
+7% |
3 |
1.2% |
|
Check 4 |
1,600 |
4.4 min |
0.25 µm |
+9% |
4 |
1.5% |
|
End |
2,000 |
4.6 min |
0.28 µm |
+16% |
5 |
3.1% |
This dataset suggests that the wheel may have reached its practical production limit before physical wheel failure.
That distinction is critical.
Common Mistakes in Diamond Wheel Performance Evaluation
Comparing Purchase Price Only
A cheaper wheel is not necessarily a cheaper production solution.
Measuring Physical Wheel Life
A wheel that still cuts may already be producing unacceptable parts.
Ignoring Scrap
A wheel producing more parts with a higher rejection rate can have a worse economic result.
Ignoring Dressing Time
Frequent dressing can consume substantial production capacity.
Changing Multiple Variables
If wheel specification, feed, coolant and speed all change simultaneously, the trial cannot identify the cause of improvement.
Comparing Purchase Price Only
A cheaper wheel is not necessarily a cheaper production solution.
Measuring Only Initial Performance
Early wheel performance does not establish full production life.
Ignoring Machine Condition
Runout, spindle condition, rigidity and workholding can affect the result independently of the wheel.
Using Only Operator Opinion
Operator observations are valuable, but they should support measured data rather than replace it.
Using the Wrong Failure Metric
The wheel should be evaluated against the part and process requirements.
Declaring Success Without an Economic Calculation
Improved tool life matters only when it produces a meaningful production benefit.
Questions Engineers Should Ask a Diamond Wheel Supplier
Before approving a wheel for production, ask:
- What wheel specification is being recommended?
- Why is that grit size appropriate for this material?
- Why is this bond appropriate for the grinding operation?
- What machine and spindle conditions should be considered?
- What starting speed and feed range is recommended?
- What dressing method is appropriate?
- What factors are likely to cause loading or glazing?
- What measurements should be recorded during the trial?
- What constitutes the end of useful wheel life?
- Can the wheel be customized if the standard specification does not meet the production target?
- Can the supplier review a used wheel to help identify the wear mechanism?
- Can the supplier support process development if the application requires it?
UKAM states that its custom manufacturing process involves discussing application requirements, recommending a solution, confirming the tool specification in writing, manufacturing and inspecting the tool, and providing follow-up technical support.
That type of supplier interaction is most useful when the customer provides actual production data rather than only stating that the current wheel “does not last.”
Diamond Grinding Wheel Performance Checklist
Before approving a wheel, confirm that the trial has documented:
Wheel
- Diameter
- Width
- Grit
- Bond
- Bond hardness
- Profile
- Arbor/mounting
- Manufacturer specification
Machine
- Machine model
- Spindle speed
- Spindle condition
- Runout
- Workholding
- Machine rigidity
Process
- Feed rate
- Depth of cut
- Wheel speed
- Coolant
- Dressing method
- Dressing interval
Quality
- Surface finish
- Dimensional tolerance
- Profile/form
- Edge condition
- Subsurface damage where applicable
- Scrap rate
Economics
- Wheel cost
- Parts per wheel
- Acceptable parts per wheel
- Dressing cost
- Cycle time
- Machine time
- Cost per acceptable part
FAQ: Diamond Grinding Wheel Performance
Measure wheel life by the number of acceptable parts produced before the wheel can no longer maintain the defined production criteria. Those criteria may include surface finish, dimensional tolerance, profile, cycle time, grinding force, scrap rate or dressing frequency.
Not necessarily. A higher purchase price can be justified if the wheel produces enough additional acceptable parts, reduces dressing, lowers scrap, shortens cycle time or reduces total production cost. The correct comparison is cost per acceptable part rather than purchase price alone.
There is no single universal metric. For many production applications, acceptable parts per wheel and cost per acceptable part are highly useful. Surface finish, dimensional stability, cycle time, dressing interval and scrap rate should also be evaluated.
The appropriate dressing interval depends on wheel construction, material, grinding conditions and the required part quality. Instead of adopting a generic interval, establish the interval experimentally by tracking quality and wheel behavior.
A wheel can continue removing material after its process performance has degraded. If it can no longer maintain surface finish, dimensions, profile, cycle time or other acceptance criteria, its useful production life may already be over.
A wheel can continue removing material after its process performance has degraded. If it can no longer maintain surface finish, dimensions, profile, cycle time or other acceptance criteria, its useful production life may already be over.
Potential causes include abrasive wear, loading, glazing, inappropriate bond behavior, dressing conditions, incorrect process parameters, coolant problems, machine vibration, runout and workpiece changes. The correct cause should be established from process evidence rather than assumed from wheel appearance.
For production applications, parts or cycles are often more useful because they directly connect wheel behavior to production output. Time can still be recorded for machine-utilization and economic calculations.
Custom development becomes useful when a standard wheel cannot consistently meet the required combination of tool life, surface finish, dimensional accuracy, cycle time, geometry and cost. The production requirement should be clearly defined before requesting customization.
Compare them under controlled conditions using the same material, machine, coolant, inspection method and acceptance criteria wherever practical. Measure acceptable parts, wheel life, dressing frequency, cycle time, quality, scrap and cost per acceptable part.
Engineering Principles to Remember
- Wheel life should be defined by acceptable production, not physical wheel failure.
- Cost per acceptable part is more informative than wheel purchase price.
- Dressing frequency is a production variable, not just a maintenance detail.
- Cycle time can outweigh differences in wheel purchase price.
- Surface finish and dimensional stability must be tracked throughout wheel life.
- Material-specific failure modes should be included in the evaluation.
- Controlled trials are more reliable than subjective wheel comparisons.
- Machine condition and coolant delivery can influence wheel performance independently of wheel specification.
- A longer-lasting wheel is not automatically better if it increases scrap or cycle time.
- The best wheel specification is the one that maintains the required production window at an acceptable total cost.
How UKAM Approaches Diamond Grinding Wheel Applications
UKAM manufactures diamond and CBN wheels for different applications and offers multiple bond technologies, including sintered metal bond, resin bond, hybrid, electroplated, brazed and vitrified technologies. Its published product information also identifies different wheel sizes, grit ranges, concentrations and bond hardness options.
For applications where a standard wheel does not meet the required production conditions, UKAM states that it provides custom manufacturing based on customer specifications and application requirements. Its custom manufacturing process considers factors such as material, equipment, tolerances, surface finish and desired tool life.
UKAM also describes SMART CUT technology as using oriented and distributed diamond or CBN crystals within the bond matrix. Its published technology information states that the design is intended to support consistent cutting behavior and reduce the need for frequent dressing. These statements should be evaluated against the specific application rather than treated as universal production guarantees.
For engineers, the most useful starting point is therefore not simply selecting a wheel from a catalog.
It is defining the production requirement and measuring whether the wheel can consistently meet it.
Final Takeaway
Diamond grinding wheel performance should be evaluated as a production system.
The wheel is only one part of that system.
Machine condition, wheel specification, abrasive characteristics, bond behavior, dressing, coolant delivery, grinding parameters, material condition and inspection criteria all influence the final result.
The most useful evaluation connects these variables to measurable production outcomes:
Wheel life → acceptable parts → cycle time → quality → scrap → total production cost
A wheel that produces more acceptable parts, maintains dimensional and surface requirements, requires fewer interventions and lowers cost per acceptable part has a stronger production case than a wheel selected only because its purchase price is lower.
Before changing a diamond grinding wheel, establish the baseline.
Before approving a new wheel, define the acceptance criteria.
During the trial, measure the complete process.
And when comparing suppliers or wheel technologies, evaluate the result using the production metrics that actually matter to the manufacturing operation.
If the required performance cannot be achieved with a standard specification, a controlled custom-tool development program can provide a more practical path than repeatedly changing wheels without identifying the underlying process requirement.
For application-specific diamond and CBN wheel requirements, UKAM Industrial Superhard Tools provides standard and custom wheel solutions across multiple bond technologies. Engineers can provide the workpiece material, grinding operation, machine information, quality requirements and current wheel performance data for technical evaluation.
Trusted by Tens of Thousands of Manufacturers, Laboratories,
Research Institutions Worldwide Since 1990
American Based Manufacturer
Established in 1990
