











Skip to navigation Skip to main content
Home > Blog > How to Read and Evaluate Diamond Blade Test Reports
Diamond Blade Articles, blog

How to Read and Evaluate Diamond Blade Test Reports

How to Read and Evaluate Diamond Blade Test Reports

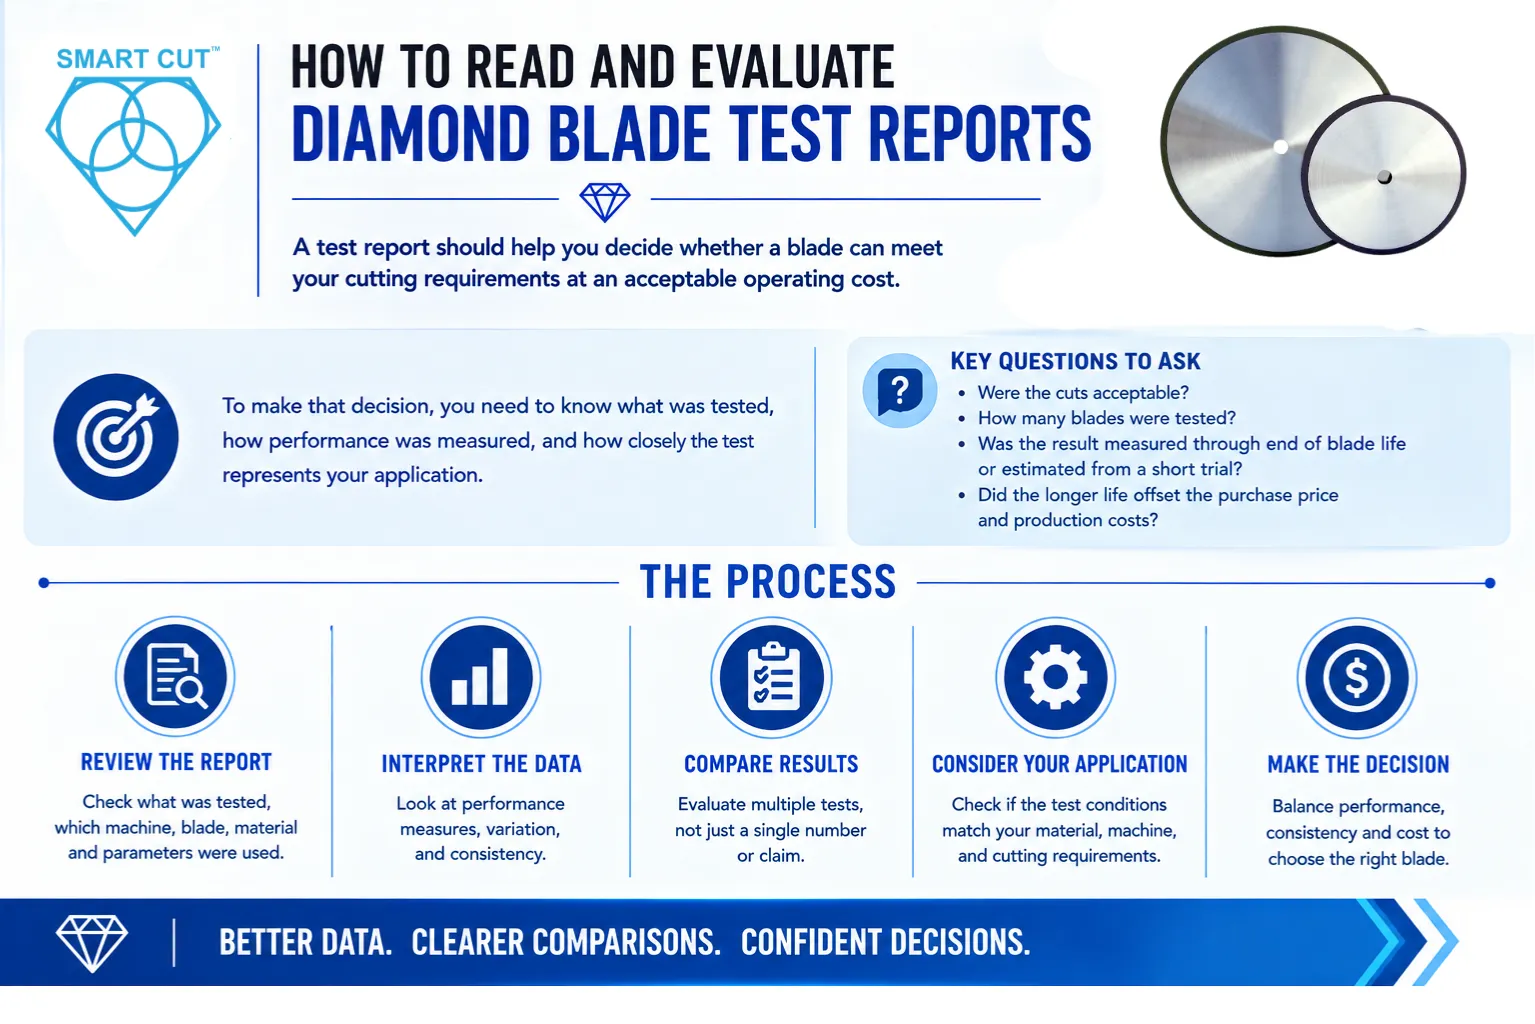
A diamond blade test report should help you decide whether a blade can meet your cutting requirements at an acceptable operating cost. To make that decision, you need to know what was tested, how performance was measured, and how closely the test represents your application.

A claim of 20% longer blade life leaves several questions unanswered. Were the cuts acceptable? How many blades were tested? Was the result measured through the end of blade life or estimated from a short trial? Did the longer life offset the purchase price and production costs?

This guide explains how to review the evidence, interpret variation, and compare results. It applies to precision diamond and CBN cutting blade reports, including laboratory sectioning, wafering, and dicing applications.

Trusted by Tens of Thousands of Manufacturers, Laboratories Research Institutions Worldwide Since 1990

American Based Manufacturer

Established in 1990

Custom manufacturing

Establish what the report can support

Establish what the report can support

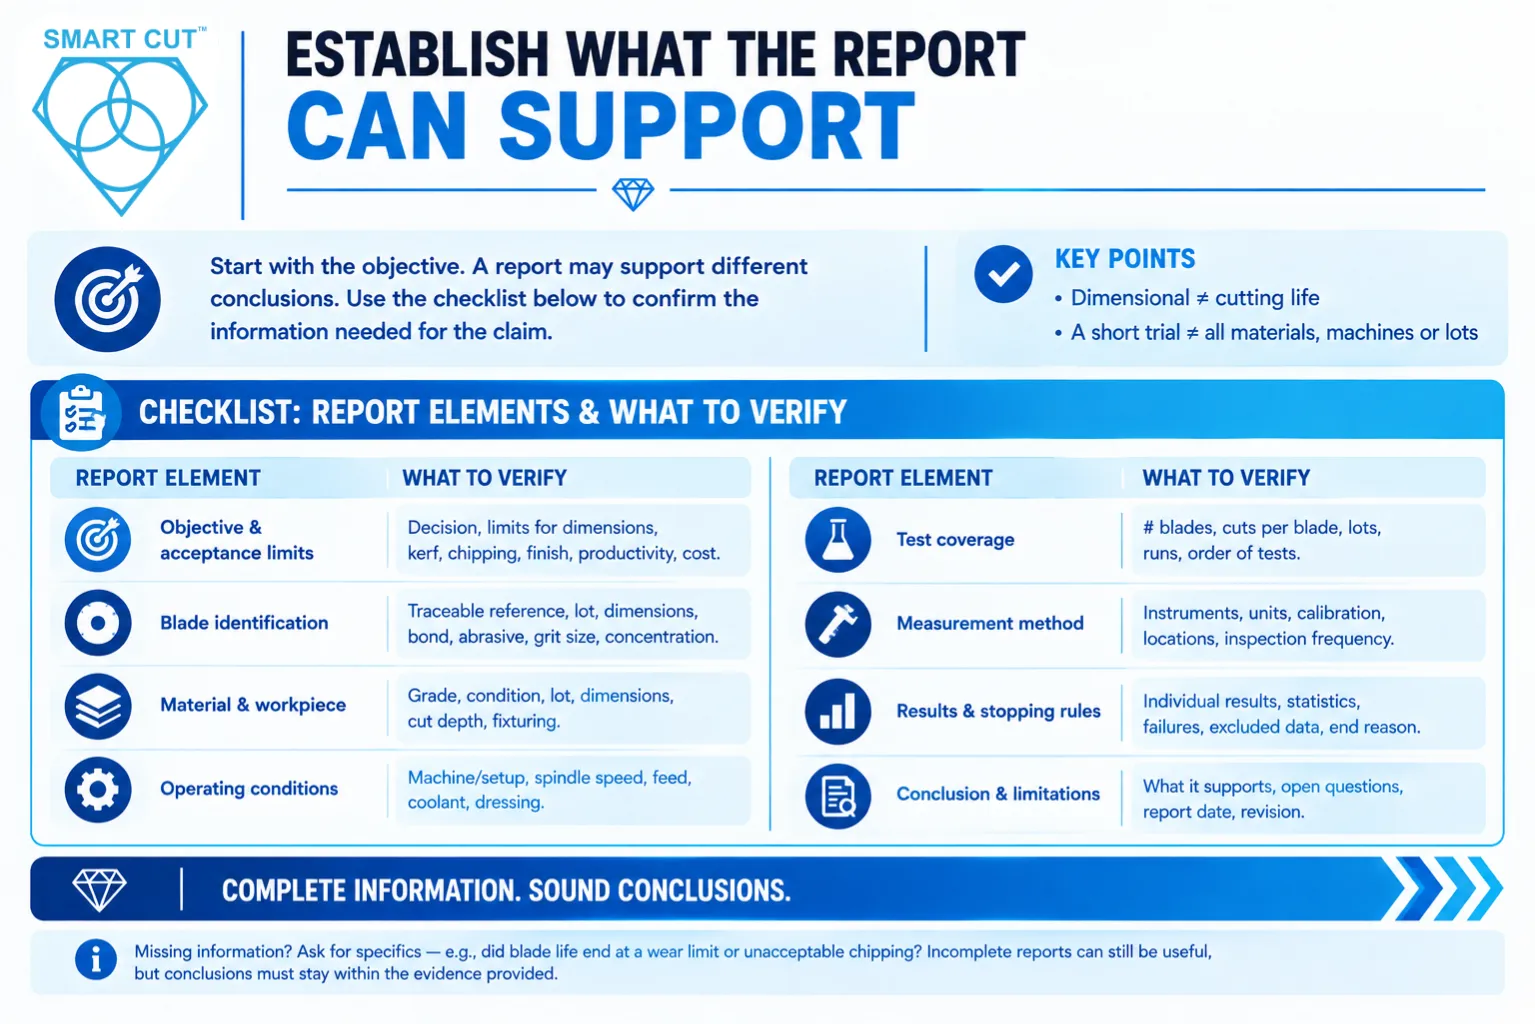
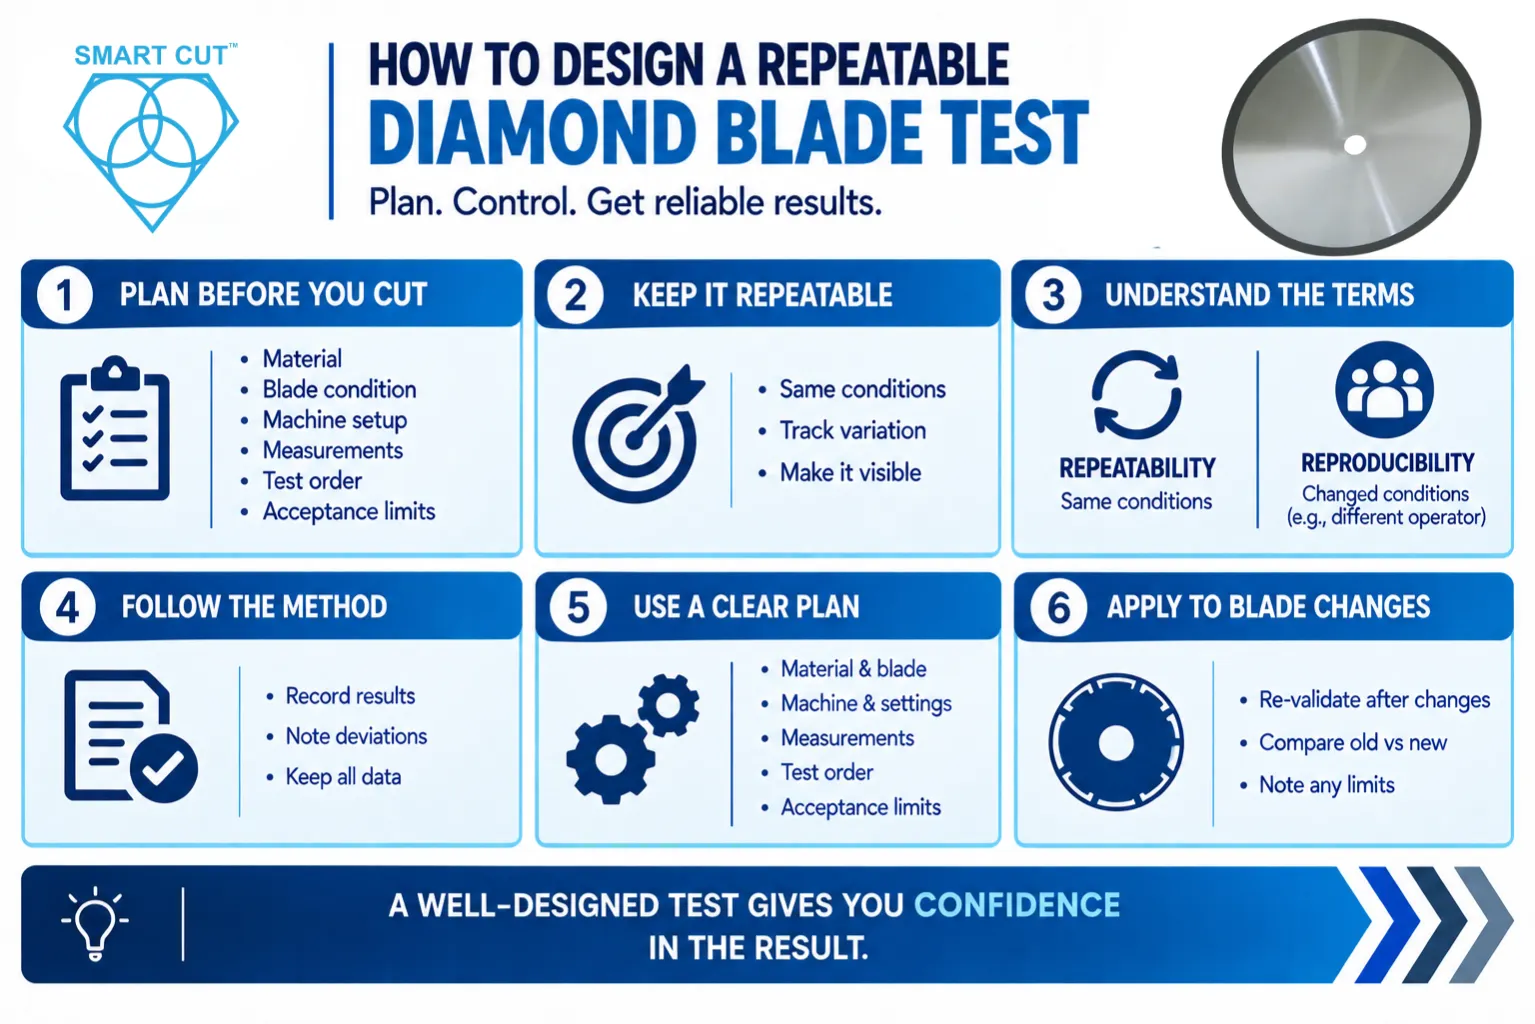
Start with the objective. A report may document dimensional inspection, initial cutting capability, comparative performance, or production qualification. Each supports a different conclusion. A dimensional inspection report does not establish cutting life. A successful short trial does not establish performance across every material, machine, or production lot.

Use the following checklist to identify the information needed for the claim being made.

Report elementWhat to verify
Objective and acceptance limitsThe decision being evaluated and the required limits for dimensions, kerf, chipping, finish, productivity, and cost.
Blade identificationA traceable blade reference, production lot, dimensions, bond, abrasive type, grit size, and concentration where applicable.
Material and workpieceMaterial grade, condition, lot, dimensions, cut depth, and fixturing.
Operating conditionsMachine and mounting setup, spindle speed, feed, coolant, and dressing procedure.
Test coverageNumber of blades, cuts per blade, lots, runs, and the order in which tests were conducted.
Measurement methodInstruments, units, calibration status, measurement locations, and inspection frequency.
Results and stopping rulesIndividual results, summary statistics, failures, excluded data, and the reason each test ended.
Conclusion and limitationsWhat the results support, unresolved questions, report date, and revision.

Missing information should lead to a specific request. For example, ask whether blade life ended at a wear limit or at unacceptable chipping. An incomplete report may still contain useful observations, but its conclusions must stay within the evidence provided.

Check that the test represents your application

Compare the report with your actual process. Material grade, workpiece geometry, blade exposure, mounting condition, feed, coolant delivery, and dressing can all affect the result. Record spindle speed and blade diameter together when reviewing peripheral speed. Equal RPM does not produce equal peripheral speed when diameters differ.

Identify whether the report compares blades at common settings or compares a separately optimized process for each blade. Both approaches can be useful. A change in blade, feed, and coolant at the same time measures the combined process change. It does not isolate the contribution of the blade.

Apply the same review standard to manufacturer, customer, and independent laboratory reports. Controlled conditions improve interpretability. Your production trial establishes whether the result transfers to your material, equipment, and requirements.

Read each measurement on its stated basis

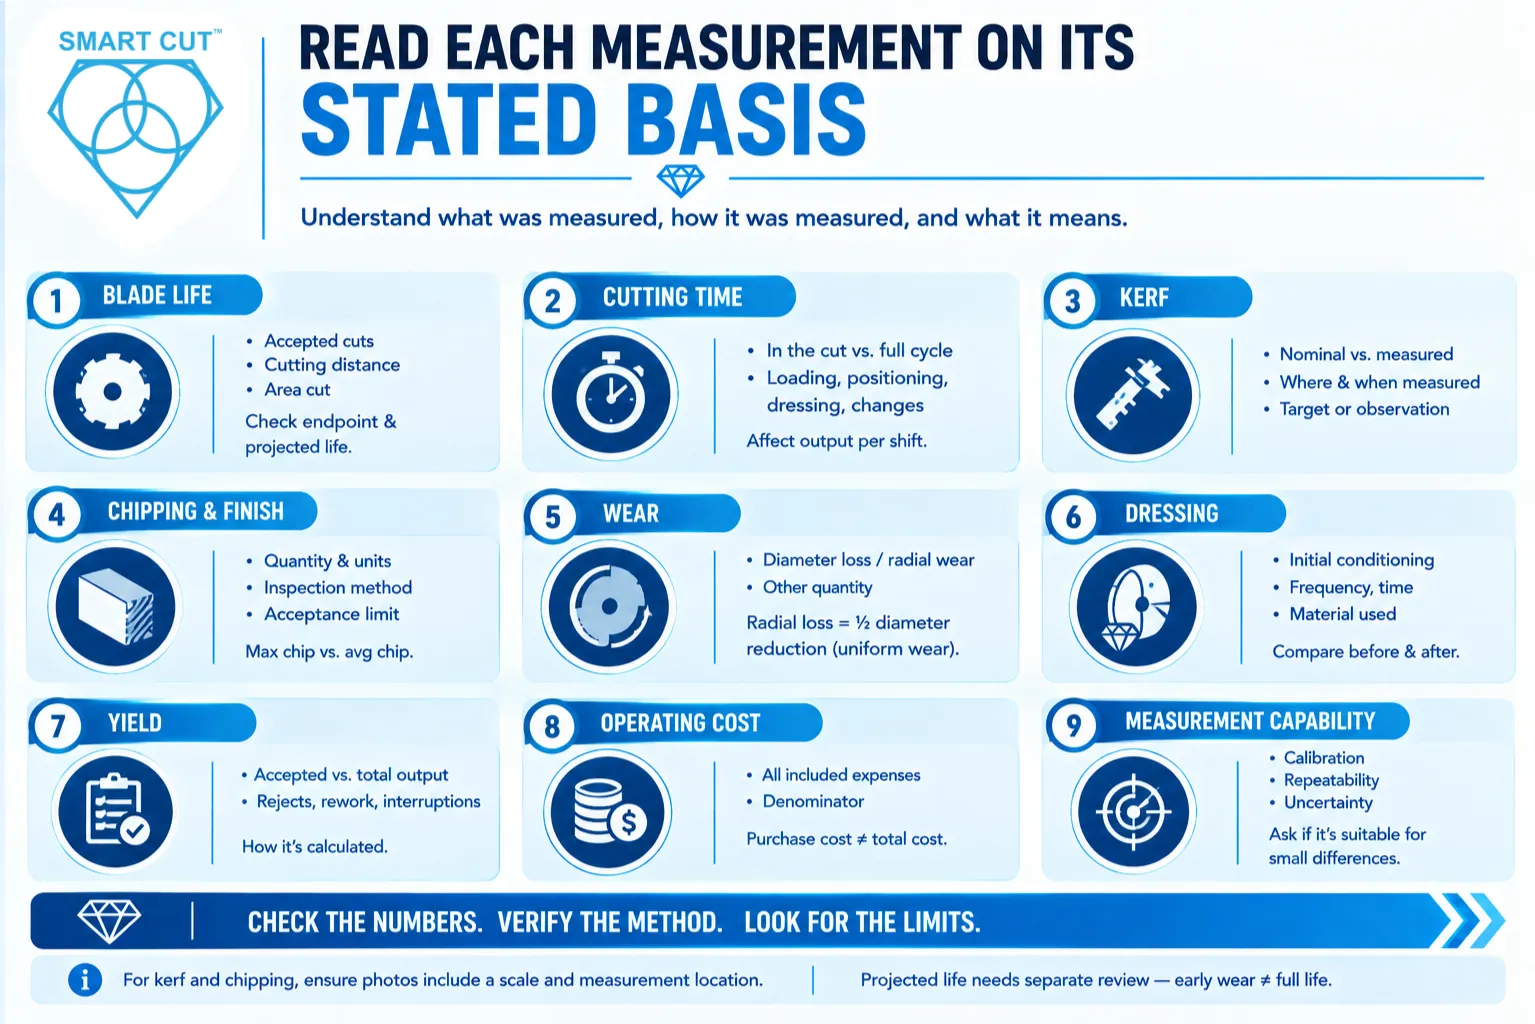
MetricHow to interpret it
Blade lifeIdentify whether life means accepted cuts, cutting distance, or area cut. Check the endpoint and distinguish measured life from projected life.
Cutting timeSeparate time in the cut from the full cycle. Loading, positioning, dressing, and blade changes affect output per shift.
KerfSeparate nominal blade thickness from measured cut width. Check where and when the kerf was measured and whether the value is a target or an observation.
Chipping and finishLook for the measured quantity, units, inspection method, and acceptance limit. A maximum chip size and an average chip size answer different questions.
WearConfirm whether the report measures diameter loss, radial wear, or another quantity. For uniform outside-diameter wear, radial loss is half the diameter reduction.
DressingCheck initial conditioning, dressing frequency, time, and material consumed. Compare early performance with performance after conditioning.
YieldReview accepted output relative to total output inspected. State how rejects, rework, and interrupted cuts were treated.
Operating costIdentify every included expense and the denominator. Blade purchase cost per cut does not include all production costs.

Measurement capability matters when differences are small. A display with fine resolution does not by itself establish sufficient accuracy. Ask whether calibration, repeatability, and measurement uncertainty are suitable for the claimed difference. For kerf and chipping, photographs should include a scale and identify the measurement location.

Projected life deserves separate attention. Extrapolating early wear assumes that the observed wear rate remains representative and that another failure mechanism will not end useful life sooner. Check the calculation, test duration, wear trend, and stated limitations. A blade still running when the trial stops has not demonstrated its complete service life.

Interpret the average and the variation together

The average describes the center of the results

The mean gives a useful summary, but review the individual blade results as well. A few early failures can matter more to production than a favorable average. If the results are strongly skewed, the median and a plot of individual observations may help explain performance. Investigate exclusions and unusual results instead of silently removing them.

Spread describes consistency

The range shows the lowest and highest observations. Standard deviation describes variation around the mean. The coefficient of variation expresses standard deviation relative to the mean, usually as a percentage. Compare these measures only when the metric, units, and measurement basis are appropriate.

A narrow spread indicates consistent observations in that test. It does not establish freedom from measurement bias or prove that untested lots will behave the same way. A confidence interval addresses the precision of an estimated mean and depends on both variability and sample size.

Count independent blades separately from cuts

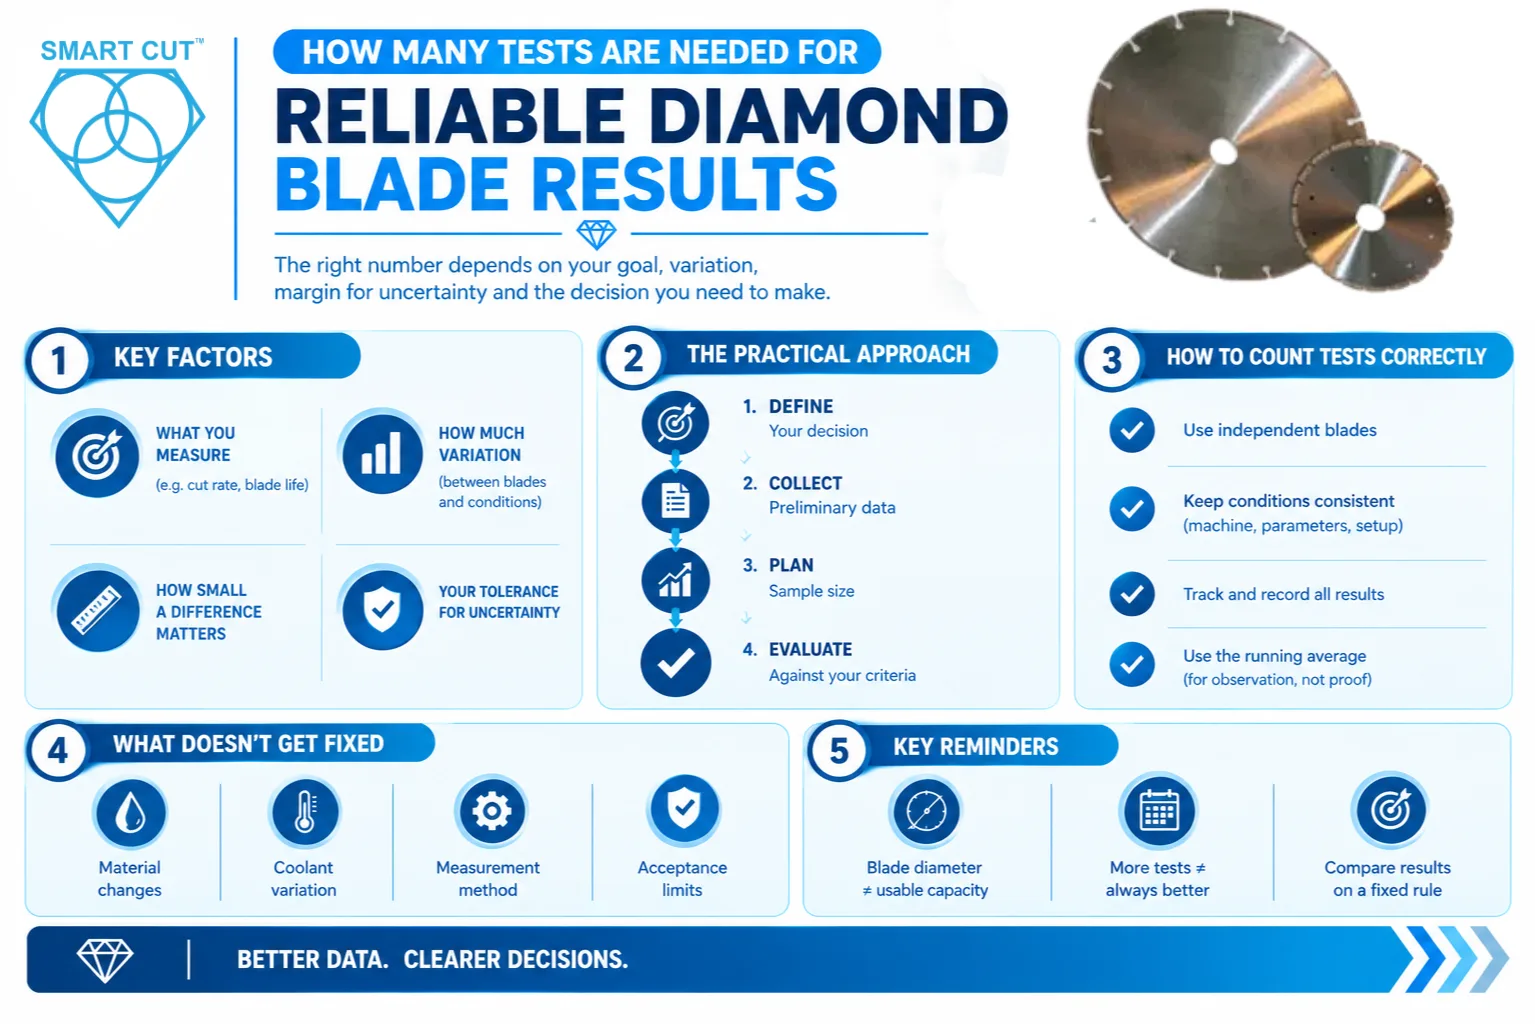
A thousand cuts from one blade describe one blade over its service history. They do not provide a thousand independent blade-life results. Check the numbers of blades, lots, and test runs. Measurements within one blade or run may be related, and the analysis should reflect that structure.

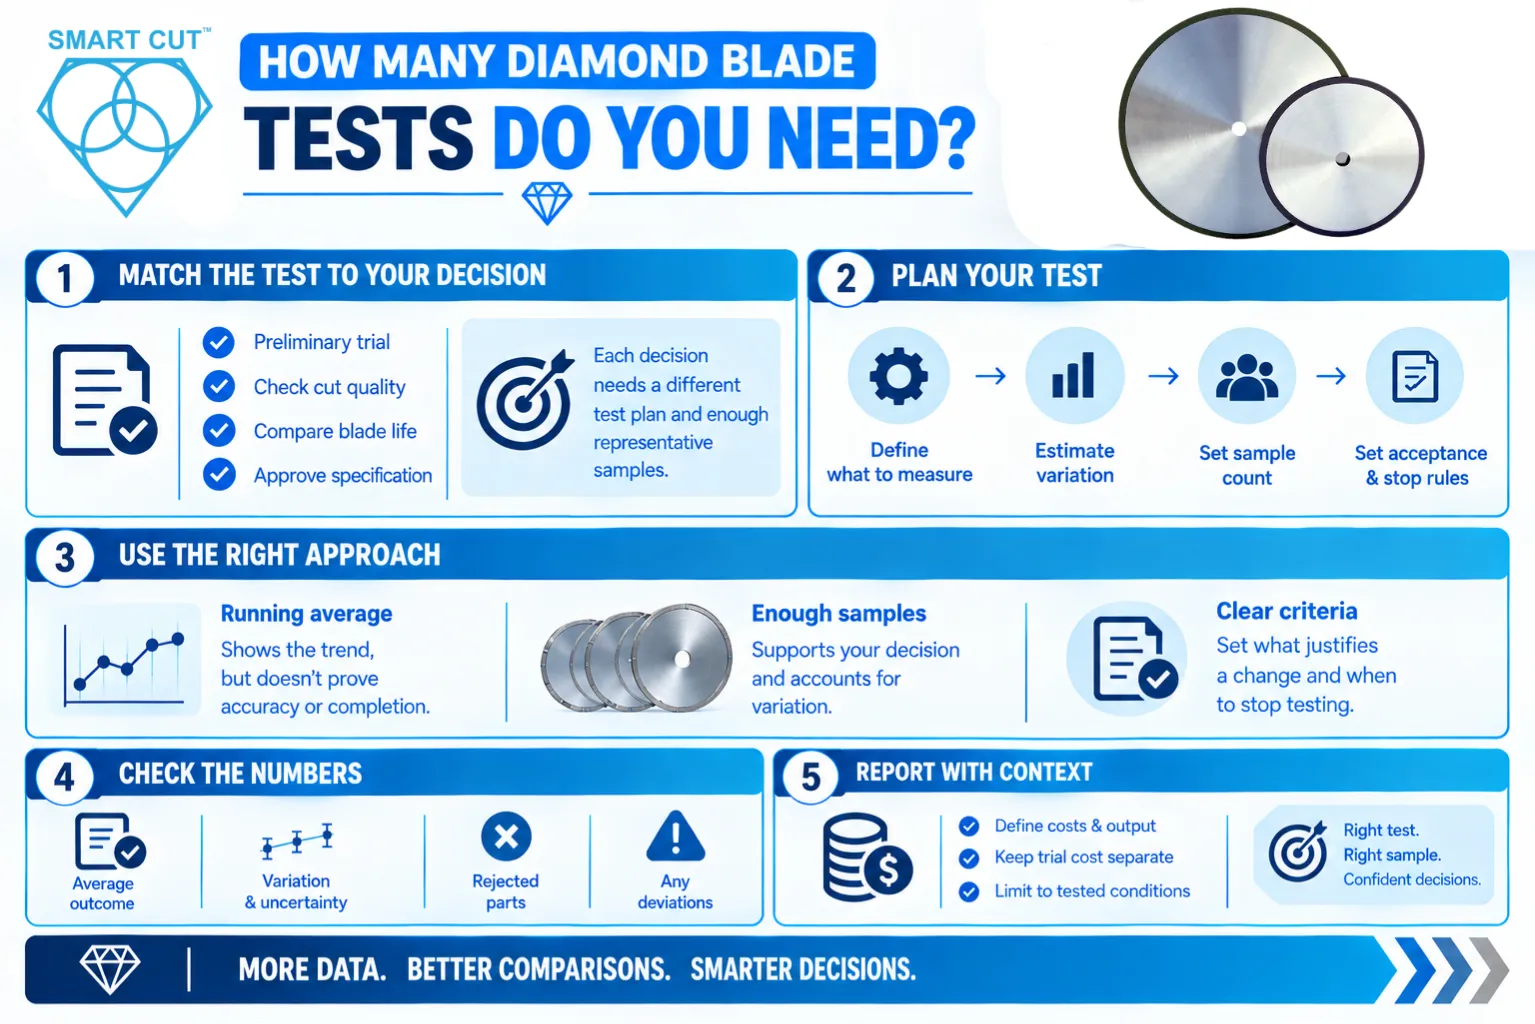
There is no universal sample count that makes every comparison reliable. Required testing depends on variability, the improvement you need to detect, the consequences of a wrong decision, and the population you want the result to represent.

Evaluate the difference directly

Overlapping individual results do not prove that two blade designs have the same average performance. Ask for the estimated difference and its confidence interval. An appropriate statistical test can assess evidence against equal means, subject to the test assumptions. Welch’s two-sample t-test is one option for independent groups when the data are suitable.

If a confidence interval for the difference includes zero, the test may be inconclusive. That does not establish equivalence. Also check practical importance. A statistically detectable improvement may be too small to justify a higher price or a process change. Conversely, an economically valuable improvement may require more testing before it can be estimated precisely.

Work through a blade comparison

Work through a blade comparison

The following data and conditions are illustrative. They explain report interpretation and do not represent measured UKAM product performance or recommended cutting settings.

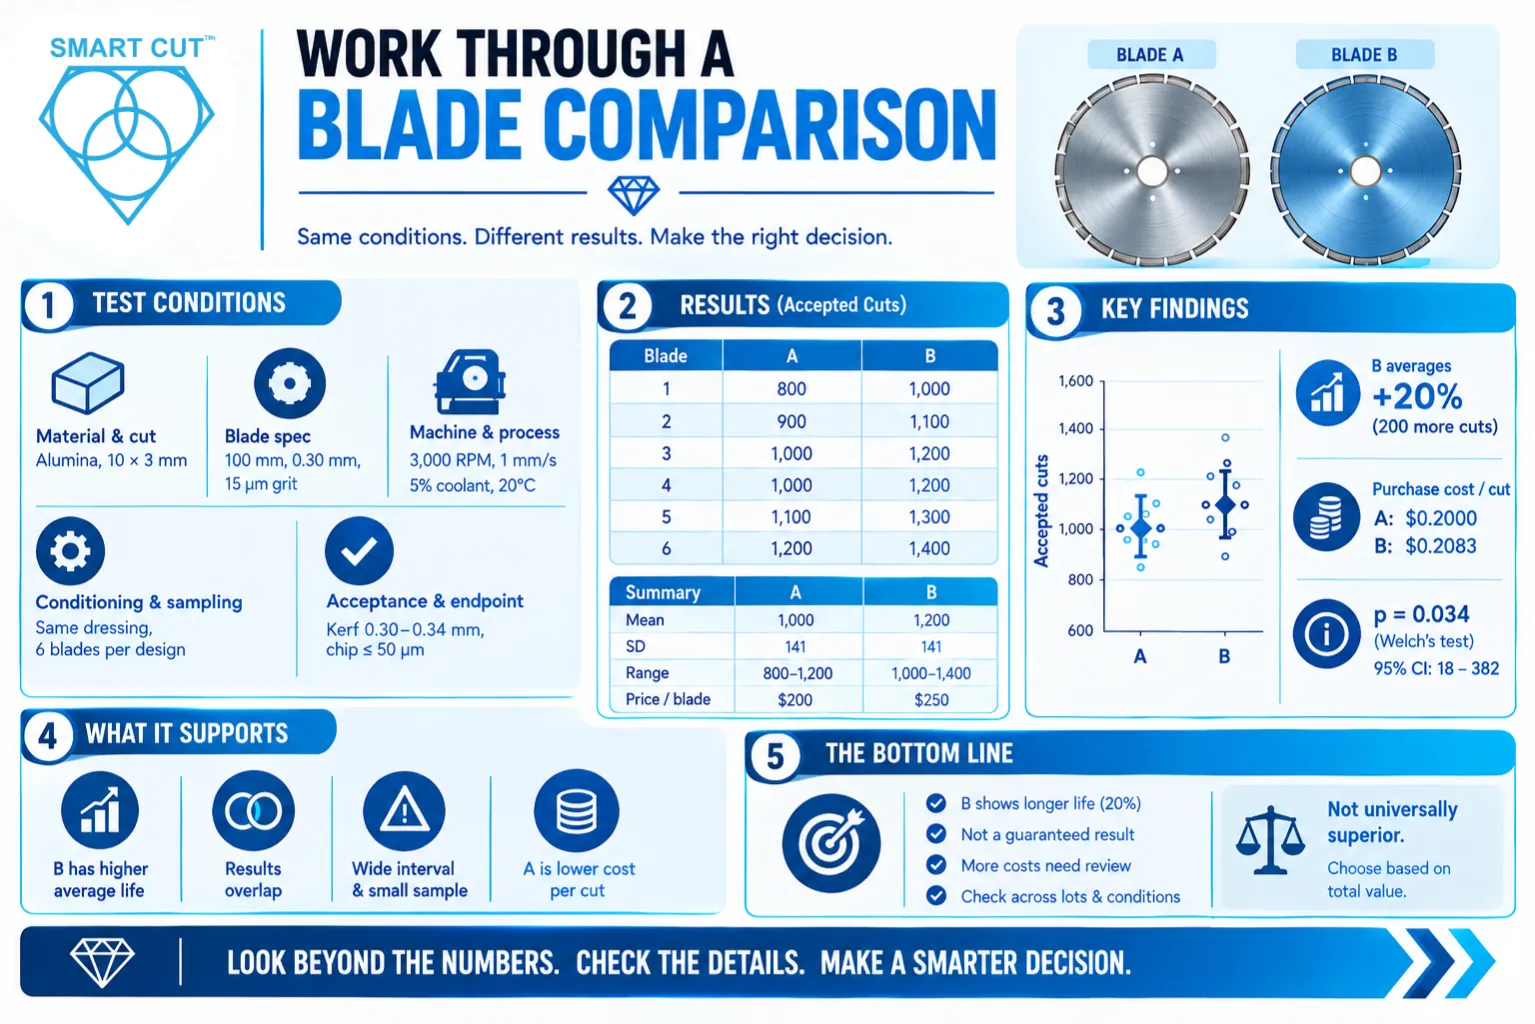
Suppose your team is reviewing two resin bond diamond blade designs for sectioning alumina. The report documents the following conditions.

Recorded conditionIllustrative test basis
Material and cutAlumina from one material lot. Each through-cut crosses a section 10 mm wide and 3 mm thick.
Blade specification100 mm outside diameter, 0.30 mm nominal rim thickness, and 15 µm diamond grit. The two designs use different resin bond formulations.
Machine and processSame saw, flanges, fixture, and coolant delivery. Spindle speed 3,000 RPM. Feed 1 mm/s. Water-based coolant at 5% concentration and a 20 °C temperature target.
Conditioning and samplingSame initial dressing procedure. No additional dressing during this comparison. Six new blades per design, drawn from one lot per design, with randomized test order.
Acceptance and endpointMeasured kerf 0.30 to 0.34 mm and maximum edge chipping 50 µm. Inspect every cut with a calibrated optical method suitable for these limits. Stop each blade at the first failure of either requirement.

Every blade reaches the endpoint. Count accepted cuts before the first failure and record the rejected endpoint cut separately. Results are sorted for readability. Each number represents a different blade. Rows do not indicate matched pairs or test order.

Observation Blade A accepted cuts Blade B accepted cuts
1 800 1,000
2 900 1,100
3 1,000 1,200
4 1,000 1,200
5 1,100 1,300
6 1,200 1,400
SummaryBlade ABlade B
Independent blades66
Mean accepted cuts per blade1,0001,200
Sample standard deviation141 cuts141 cuts
Observed range800 to 1,200 cuts1,000 to 1,400 cuts
Illustrative price per blade$200$250
Blade purchase cost per accepted cut$0.2000$0.2083

The cost calculation divides total blade purchase cost by total accepted cuts. Blade A costs $1,200 for 6,000 accepted cuts. Blade B costs $1,500 for 7,200 accepted cuts. Machine time, labor, coolant, dressing, and rejected workpieces are excluded from these purchase-cost figures.

What the example supports

Accepted-cuts-per-blade
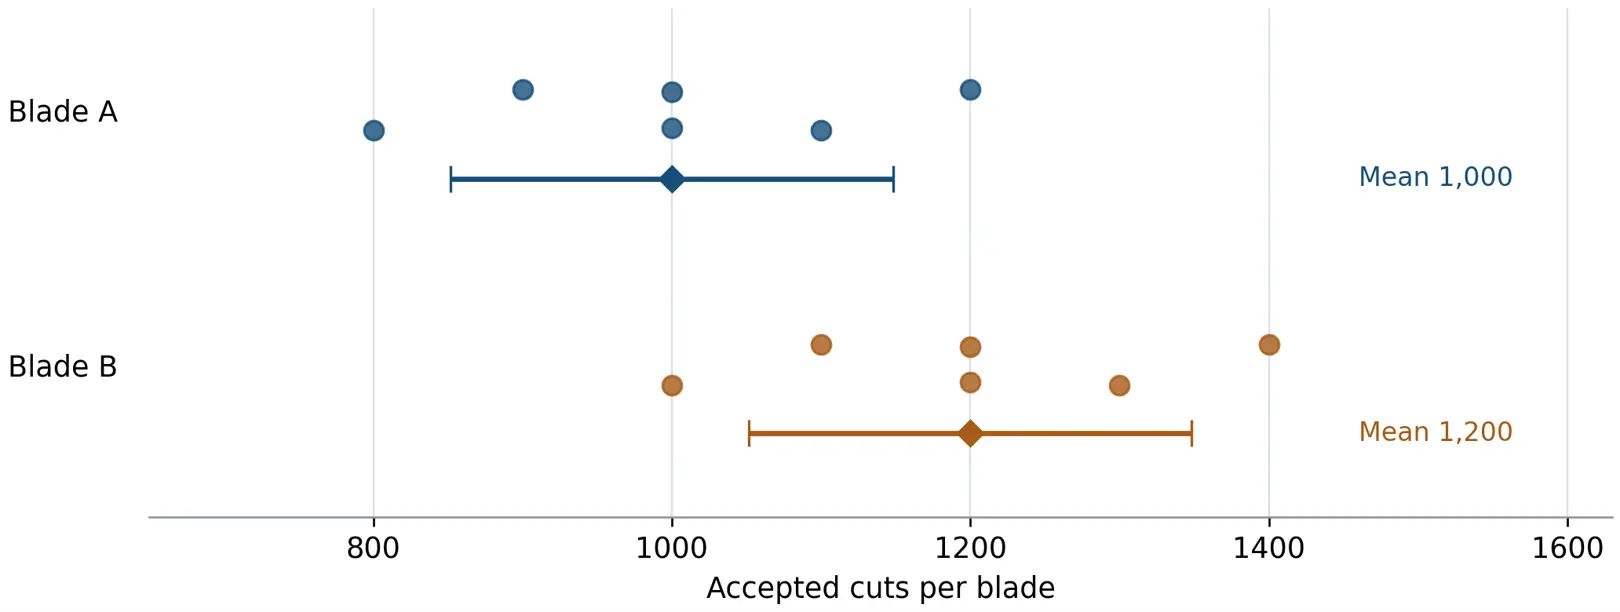
Figure 1. Illustrative blade-life results. Circles represent individual blades. Diamonds show means. Bars show 95% t confidence intervals for the group means. Assess the difference directly rather than judging significance by overlap of these bars.

Blade B averages 200 more accepted cuts per blade, a 20% increase relative to Blade A. The individual results overlap. Under an independent-sample model with approximately normal blade-life distributions, a two-sided Welch’s test gives p = 0.034. The 95% confidence interval is approximately 18 to 382 additional accepted cuts for B minus A. At a prespecified 5% significance level, these calculations support a positive average difference under the stated assumptions.

The interval is wide. Six blades per design provide limited precision, and one production lot per design leaves variation across future lots untested. The result does not establish a guaranteed 20% improvement or isolate design effects from possible lot effects.

Blade B also has approximately 4.2% higher blade purchase cost per accepted cut. Longer life alone therefore does not settle the buying decision. Blade A has the lower purchase cost per accepted cut in this example. Blade B may still have lower total process cost if fewer blade changes or other documented savings offset the difference.

A defensible report would recommend reviewing those additional costs and confirming performance across representative production conditions and lots before a broad change. It would not describe either blade as universally superior.

Compare cost on a useful production basis

Compare cost on a useful production basis

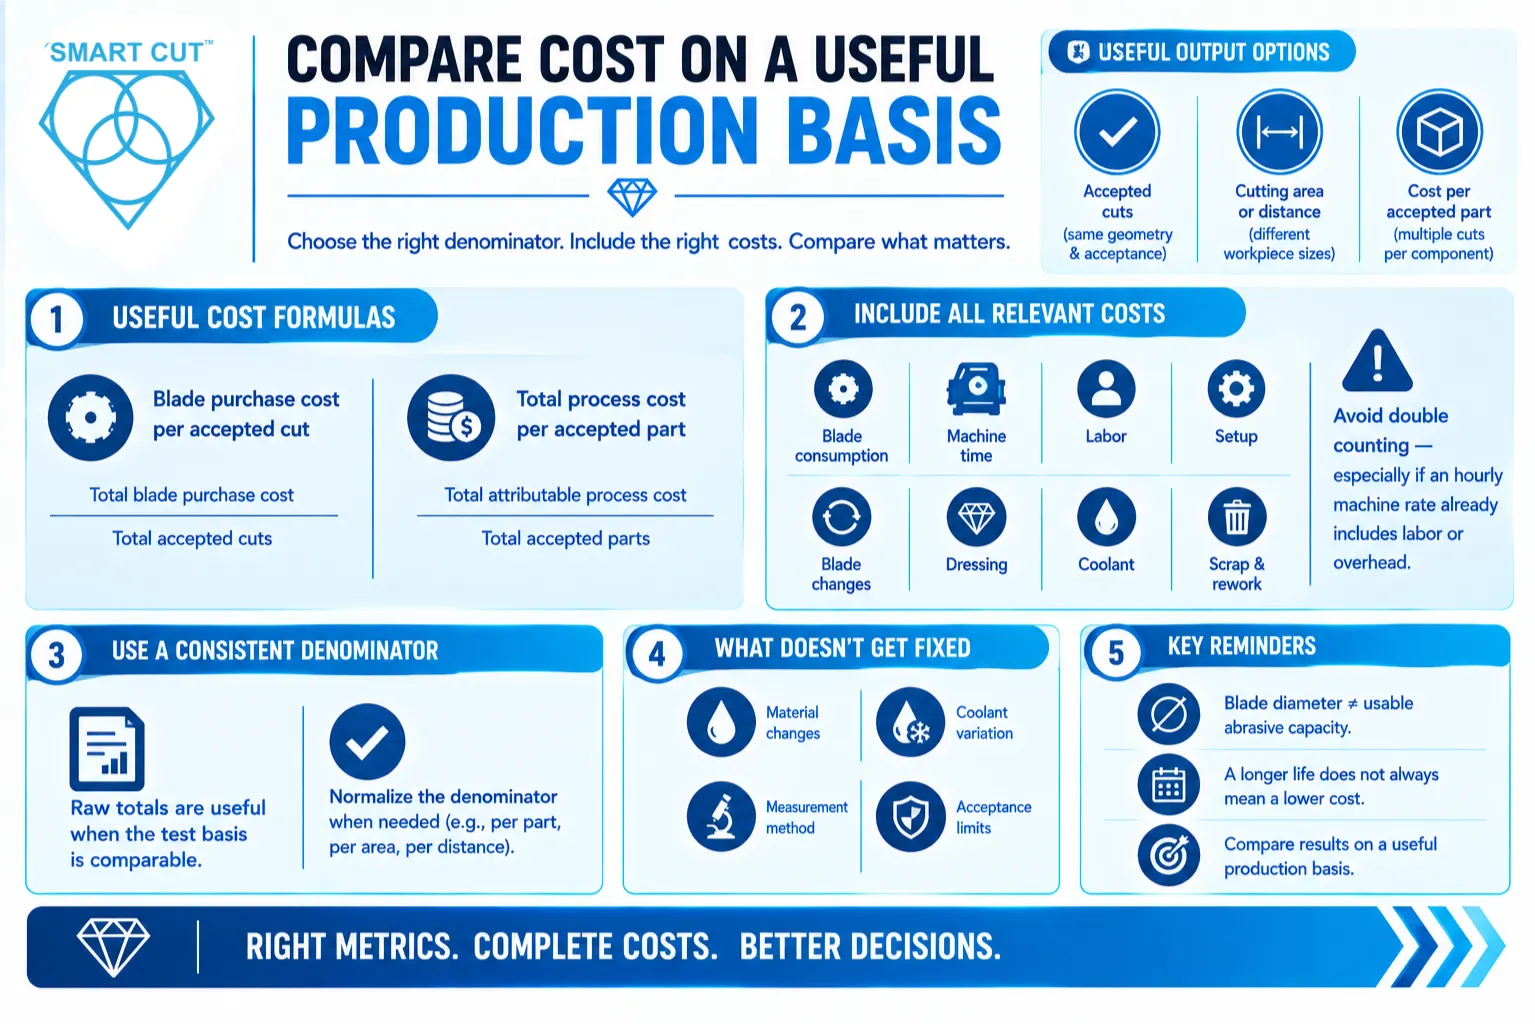
Choose a denominator that represents useful output. Accepted cuts can work when cut geometry and acceptance requirements match. Cutting area or distance can help when workpiece sizes differ. Cost per accepted part may be more useful when several cuts are required for one finished component.

Blade purchase cost per accepted cut = Total blade purchase cost ÷ Total accepted cuts

Total process cost per accepted part = Total attributable process cost ÷ Total accepted parts

Define the included costs before comparing results. Depending on the decision, they may include blade consumption, machine time, labor, setup, blade changes, dressing, coolant, scrap, and rework. Avoid counting the same expense twice when an hourly machine rate already includes labor or overhead.

Raw totals remain useful when the test basis is comparable. Normalization makes the denominator consistent. It does not correct differences in material, coolant, measurement method, or acceptance limits. Blade diameter alone also does not establish usable abrasive capacity or cutting life.

Turn the report into a production decision

First, apply the mandatory requirements. A blade that fails a required kerf, dimensional, or chipping limit cannot qualify through a favorable average score for speed or price.

Next, compare the acceptable options using your operating priorities. Consider total cost, useful output, consistency, blade-change frequency, and the amount of further testing needed. If you use a weighted score, define the weights before reviewing the final ranking and keep every pass-or-fail requirement separate.

FindingAppropriate next action
Required information is missingRequest the missing conditions, raw results, measurement method, or endpoint before accepting the associated claim.
A required quality limit is exceededInvestigate the cause and repeat the relevant validation after an approved change.
Results are promising but uncertainExtend testing across additional independent blades and relevant lots or operating conditions.
Requirements are met and the evidence fits the intended useDocument the approved specification, operating conditions, inspection requirements, and production monitoring plan.

Ask additional questions when failures disappear from the results, a short test is presented as full blade life, several process variables change without disclosure, or a conclusion extends beyond the tested material and conditions. The severity of the missing evidence matters more than the number of omissions.

Frequently Asked Questions

The number depends on observed variation and the decision you need to make. A single blade can demonstrate an observation under stated conditions. Estimating consistency and average life requires independent blade results, with coverage of lots and operating conditions appropriate to the intended use.

Check whether both values describe measured cut width, where the measurement was taken, and the cutting conditions. Nominal blade thickness, a target kerf, and a measured groove width are different information. Compare measured values only after confirming a compatible basis.

It indicates less variation in the reported metric for that sample. You still need to check the average result, acceptance limits, measurement quality, and test coverage. Consistently unacceptable cuts remain unacceptable.

The result may reflect a small difference, high variability, or insufficient testing. Review the confidence interval and the size of the improvement that matters to your process. A claim of equivalence requires a suitable analysis and a defined acceptable difference.

Only after the blade meets your quality requirements and the cost basis is comparable. Check whether the calculation includes accepted output, rejects, dressing, downtime, and other relevant expenses. A lower blade purchase cost per cut may not mean lower production cost.

It can support a conditional estimate when the wear model is appropriate. The report should state its assumptions and distinguish projected life from observed life. Confirm that changing wear rates, cut-quality deterioration, and other stopping conditions have been considered.

Get help interpreting your blade test report

Send UKAM your report together with the material and workpiece dimensions, blade specifications, machine settings, coolant and dressing details, and required cut quality. Include individual blade results and photographs with measurement scales when available.

Our applications engineering team can help you review the comparison basis, identify missing information, and determine what additional evaluation would support blade selection for your application.

Request applications engineering assistance

Related UKAM reading

Trusted by Tens of Thousands of Manufacturers, Laboratories,
Research Institutions Worldwide Since 1990

American Based Manufacturer

Established in 1990

Custom manufacturing

RELATED ARTICLES

Brian is an experienced professional in the field of precision cutting tools, with over 27 years of experience in technical support. Over the years, he has helped engineers, manufacturers, researchers, and contractors find the right solutions for working with advanced and hard-to-cut materials. He’s passionate about bridging technical knowledge with real-world applications to improve efficiency and accuracy.

As an author, Brian Farberov writes extensively on diamond tool design, application engineering, return on investment strategies, and process optimization, combining technical depth with a strong understanding of customer needs and market dynamics.

author-avatar

About Brian Farberov

Brian is an experienced professional in the field of precision cutting tools, with over 27 years of experience in technical support. Over the years, he has helped engineers, manufacturers, researchers, and contractors find the right solutions for working with advanced and hard-to-cut materials. He’s passionate about bridging technical knowledge with real-world applications to improve efficiency and accuracy. As an author, Brian Farberov writes extensively on diamond tool design, application engineering, return on investment strategies, and process optimization, combining technical depth with a strong understanding of customer needs and market dynamics.

Download Checklist

Please fill in your details to download the Precision Diamond Saw Pre-Operation Checklist.